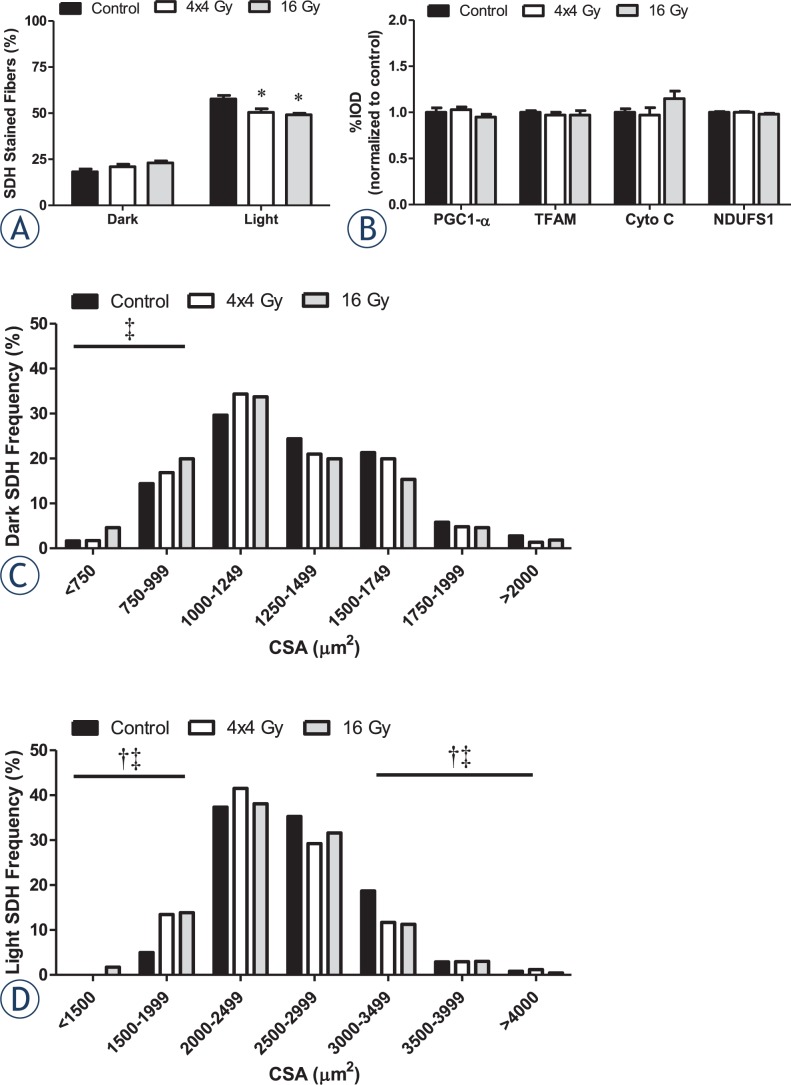
FIGURE 5.
Effects of hindlimb irradiation on muscle oxidative capacity. A The percentage of dark and light SDH stained myofibers in the tibialis anterior muscle. B Quantification of total forms of PGC-1α, TFAM, cytochrome C, and NDUFS1 proteins in the gastrocnemius muscle. C Mean cross-sectional area (CSA) distribution of dark SDH stained myofibers in the tibialis anterior muscle. D Mean CSA distribution of light SDH stained myofibers in the tibialis anterior muscle. The frequencies of small and large myofibers (±2SD of mean) were compared by Chi-square analysis. Values are means ± standard error. Statistical significance was set at P<.05. Black box, Control. White box, 4x4 Gy. Grey box, 16 Gy. μm = micrometer; Gy = gray; * = statistically different from control; † = statistical difference between control and 4x4 Gy; ‡ = statistical difference between control and 16 Gy.

