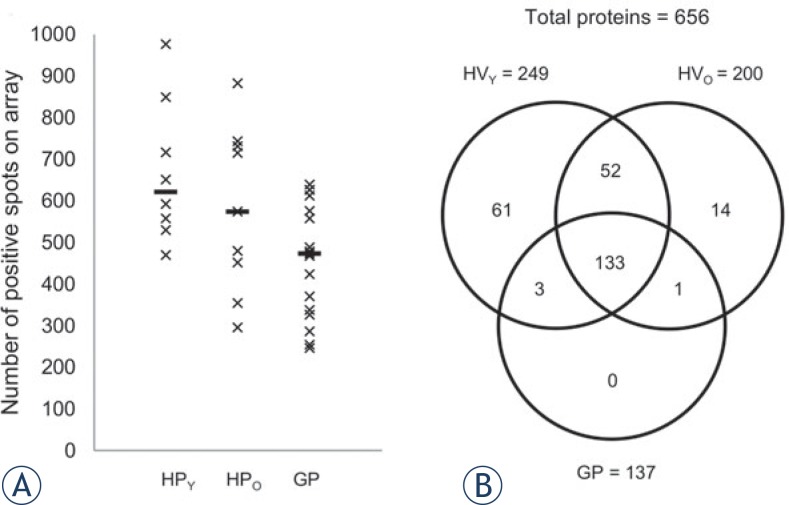
FIGURE 1.
Differences in the detectable levels of the plasma proteins in healthy volunteers and patients with GBM. (A) Comparison of the positive spots (of 1312 spots on each array) in the younger HVs (<40 years; n = 8), the older HVs (≥40 years; n = 9) and all of the GPs (>40 years; n = 17). Horizontal bars: median for each group. (B) Venn diagram showing the overlap of the detectable proteins in the different patient groups. A protein was considered detectable when it was flagged as positive in ≥75% of the samples in the same group.

