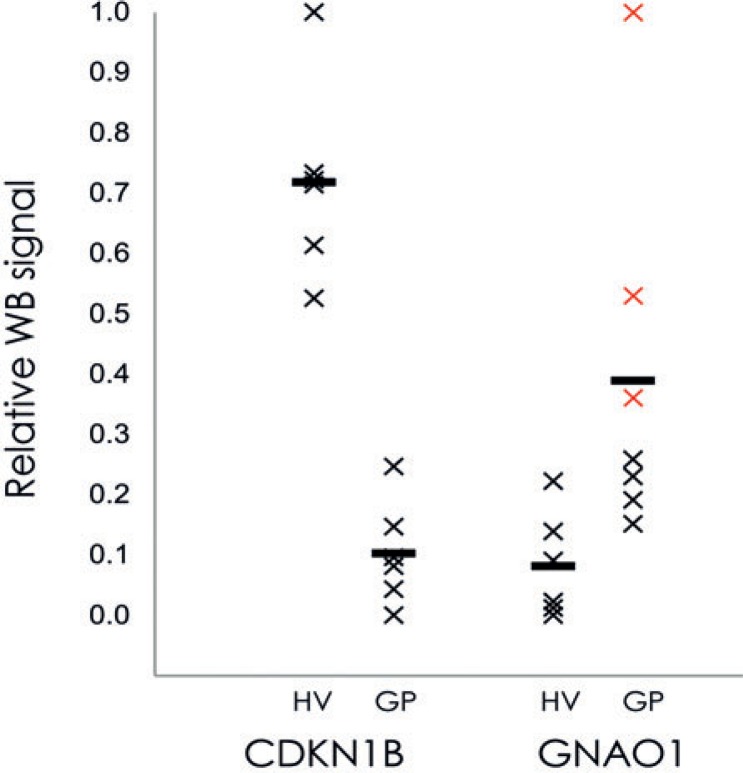
FIGURE 4.
Quantification of Western blotting signals for the two putative plasma biomarkers for patients with GMB: CDKN1B and GANO1. Plasma samples were pooled for the HVs and GPs, and following Western blotting they were quantified and normalized using image densitometry, as described in Material and Methods. Horizontal bars: mean for each group. Red crosses: GNAO1 of three pools of samples from patients who survived longer than 1 year.

