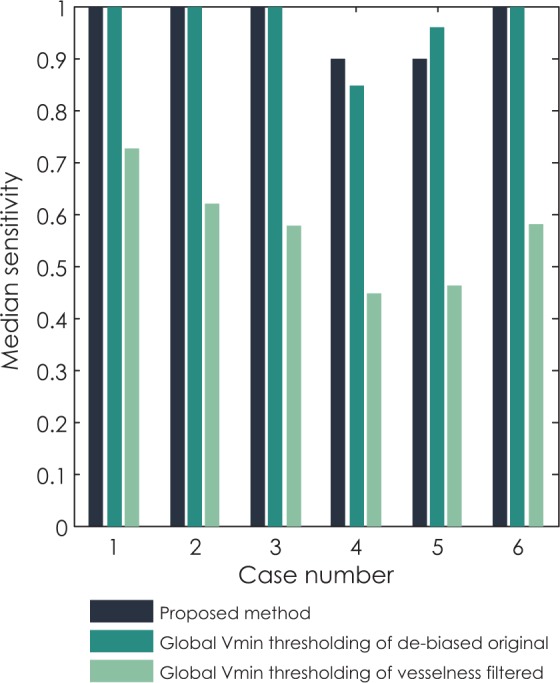
FIGURE 9.

Comparison of median sensitivity for all six clinical cases segmented with three methods: the proposed method, global variance minimization thresholding of the original de-biased image and global variance minimization thresholding of the vesselness filtered image.
