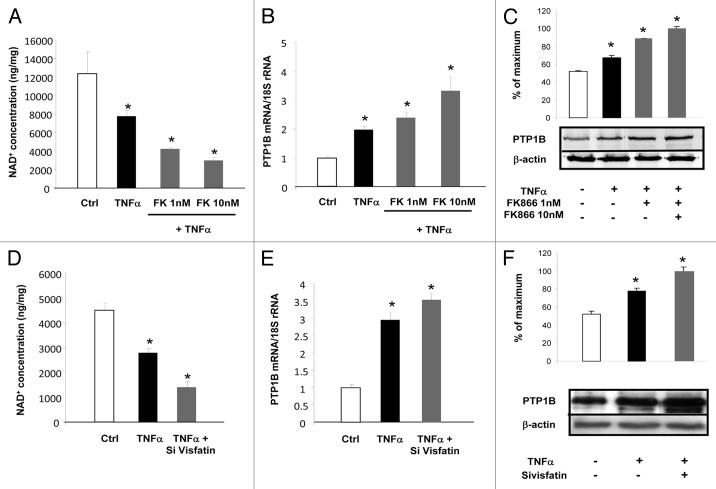
Figure 5. Inhibition of visfatin decreases NAD+ concentrations and induces PTP1B expression in 3T3-L1 adipocytes. (A–C) Cells were incubated with or without TNFα (15 ng/mL) and in the presence of the visfatin inhibitor FK866 at 1 and 10 nM for 24 h. (A) After incubation, cells were collected and processed for NAD+ quantification as described in Materials and Methods. Values were determined in ng NAD+/mg of cellular proteins. (B) PTP1B mRNA levels were quantified using real-time RT-PCR, and data were normalized to 18S rRNA. Data are presented as means ± SEM. Data were compared among groups (Student t test), and those with no common superscript letter are significantly different; P < 0.05. (C) Total cell lysates (40 μg) were subjected to SDS-PAGE and immunoblotted with PTP1B or β-actin antibodies. The western blot is representative of three independent experiments. (D–F) Cells transfected with control (non-targeted) siRNA or siRNA against visfatin were incubated with or without TNFα (15 ng/mL) for 24 h. (D) 3T3-L1 cells were collected and processed for NAD+ quantification as described in Materials and Methods. Values were determined in ng NAD+/mg of cellular proteins. (E) PTP1B mRNA levels were quantified using real-time RT-PCR, and data were normalized to 18S rRNA. Data are presented as means ± SEM. Data were compared among groups (Student t test), and those with no common superscript letter are significantly different; P < 0.05. (F) Total cell lysates (40 μg) were subjected to SDS-PAGE and immunoblotted with PTP1B or β-actin antibodies. The western blot is representative of three independent experiments.

An official website of the United States government
Here's how you know
Official websites use .gov
A
.gov website belongs to an official
government organization in the United States.
Secure .gov websites use HTTPS
A lock (
) or https:// means you've safely
connected to the .gov website. Share sensitive
information only on official, secure websites.
