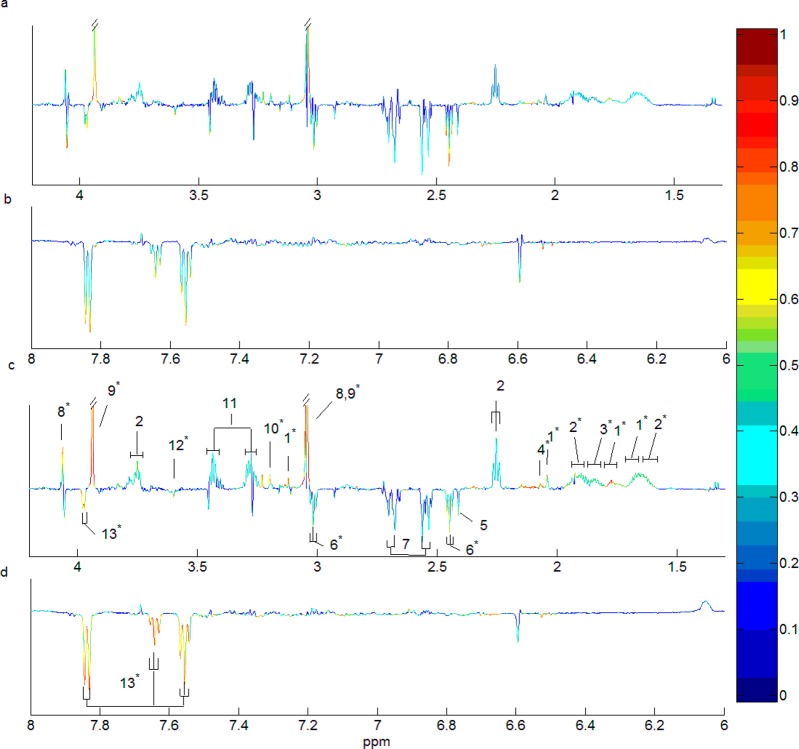
Figure 3.
OPLS-DA loading coefficient plots comparing control and hydrazine 90 mg/kg at 120–144 h for the following: (a) the aliphatic spectral region and (b) the aromatic spectral region; for the whole data set (N = 23 for control and N = 18 for hydrazine class); (c) the aliphatic spectral region and (d) the aromatic spectral region; for the homogeneous subsets (N = 23 for control and N = 9 for hydrazine class). Key: 1, N-α-acetyl-citrulline; 2,2-aminoadipic acid; 3, citruline; 4, diacetyl-hydrazine; 5, succinate; 6, 2-oxoglutarate; 7, citrate; 8, creatinine; 9, creatine; 10, beta-alanine; 11, taurine; 12, glycine; 13, hippurate. * indicates the metabolic signals were identified as “biomarkers” of response to hydrazine based on the defined criteria.

