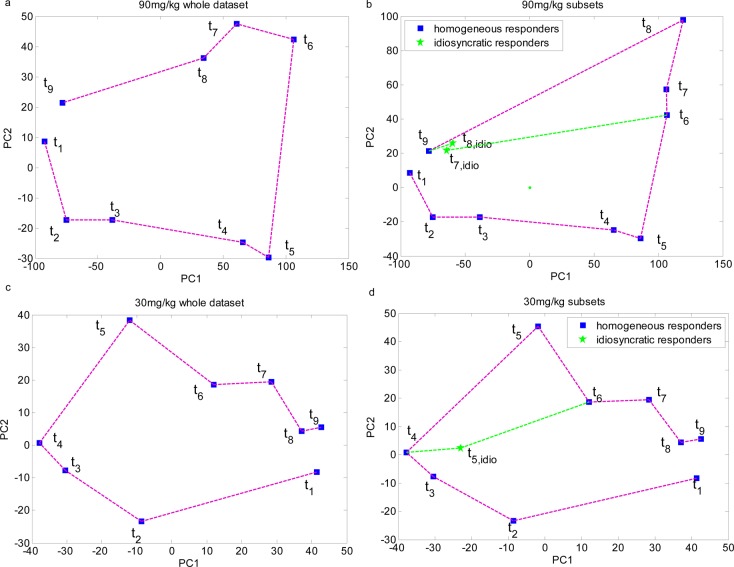
Figure 4.
PCA scores plots showing the metabolic trajectory in animals dosed with hydrazine at 90 mg/kg (a and b) and 30 mg/kg (c and d). The metabolic time trajectory was calculated by averaging the PC1 and PC2 scores, respectively, for each time point data. t1: −8–0 h; t2: 0–8 h; t3: 8–24 h; t4: 24–48 h; t5: 48–72 h; t6: 72–96 h; t7: 96–120 h; t8: 120–144 h; t9: 144–168 h.

