
Fig. 3.
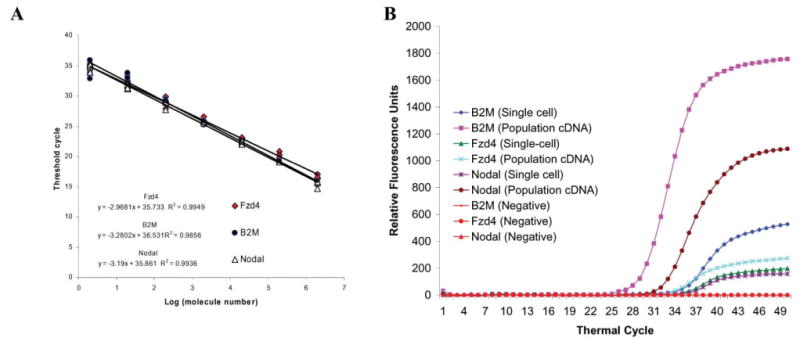
Measuring the absolute molecule number of the three genes in a single hESC with multiplex quantitative PCR. A. Standard curves are generated with known amounts of plasmid DNA containing the full sequence of the genes. The curves cover from 2 to 2 × 10⁶ copies of the respective genes. With our primer design, all the curves overlap each other, and indicate similar PCR efficiency. B. The multiplex quantitative PCR amplification curves obtained from cDNA of hESC colonies are plotted with curves obtained from cDNA of a representative hESC. Because the standard curves of the three genes are very similar, these amplification curves show that the expression ratio of B2M and Nodal is similar in population cDNA and this single-cell cDNA. However, the expression of Fzd4 and Nodal is very similar in this particular single hESC, but very different in the hESC population. Unlike this single hESC, some single hESC do not express all three genes. This result suggests the heterogeneity of hESC and underscores the importance of single-cell analysis.