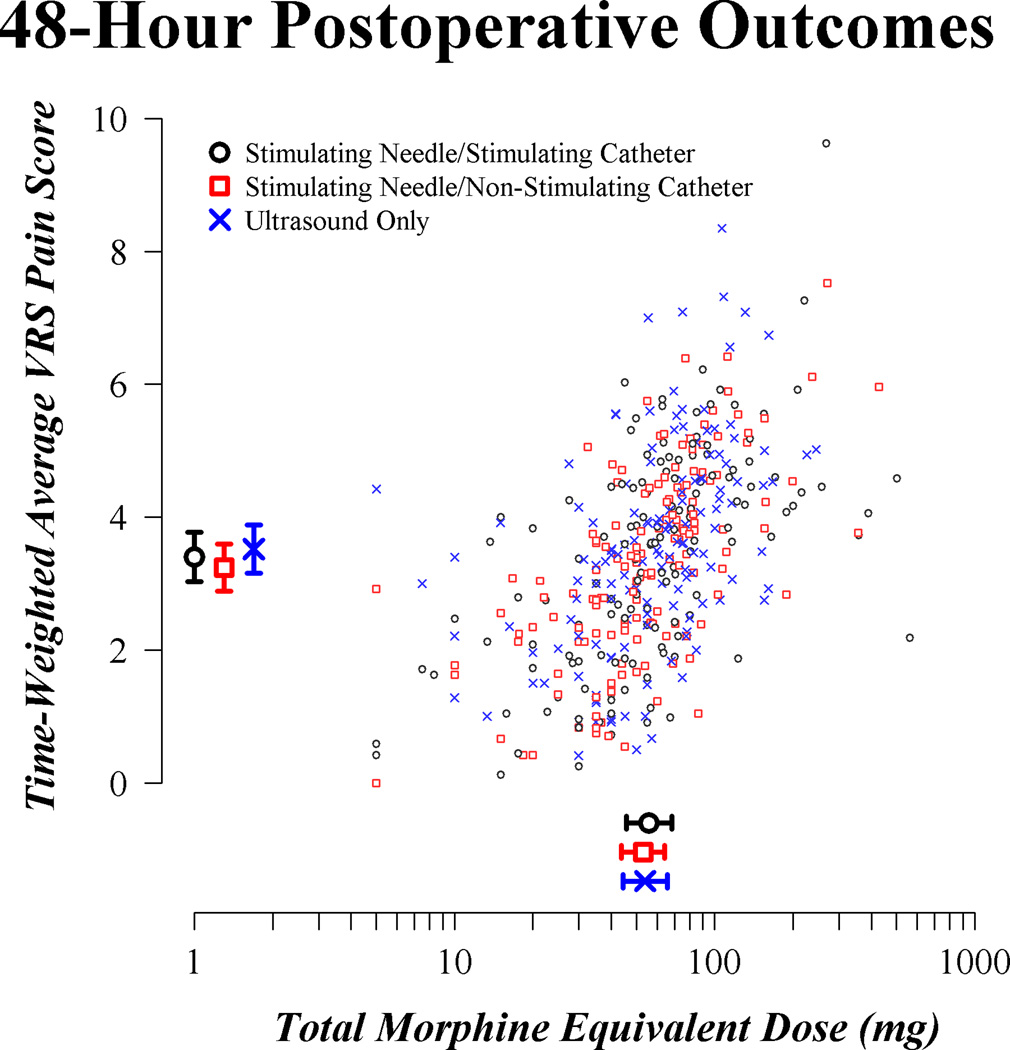
Fig. 3.
Scatterplot of primary outcomes for the enrolled patients. Estimated means for each outcome and corresponding simultaneous 95% confidence intervals are provided by group in the margins. Confidence intervals used a nominal significance criterion of 0.0023, reflecting the Bonferroni correction for six simultaneous estimates and the adjustment for interim monitoring. VRS = verbal response scale

