
Fig. 3.
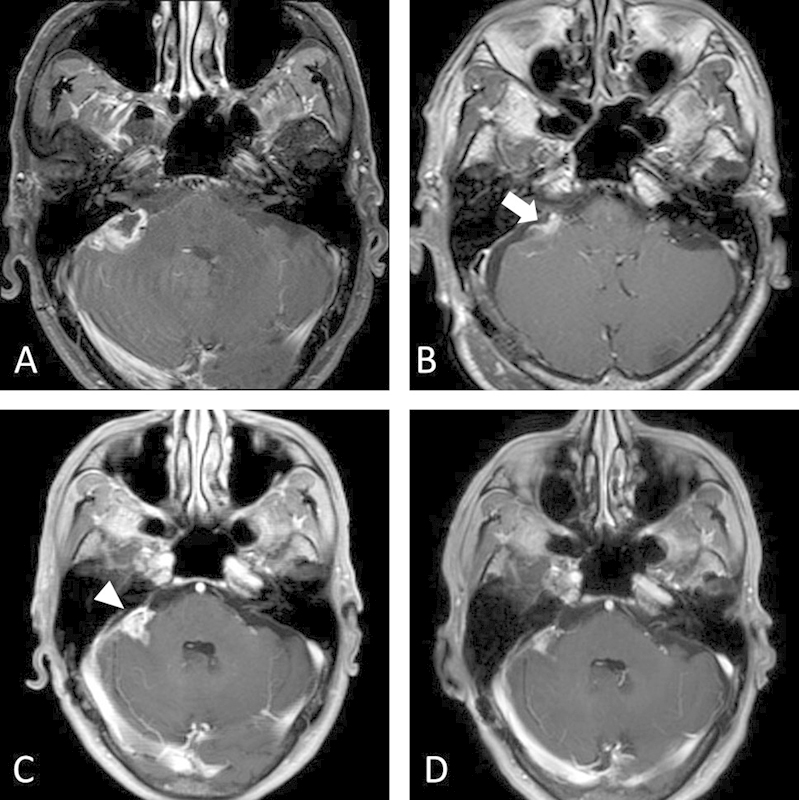
Axial T1-weighted image with gadolinium (A) before the operation, (B) 1 day after the operation, (C) 13 months after the operation, and (D) 20 months after the operation. The arrow indicates the faint residual tumor adjacent to the petrosal vein. The arrowhead indicates enlargement of the residual enhancing mass.