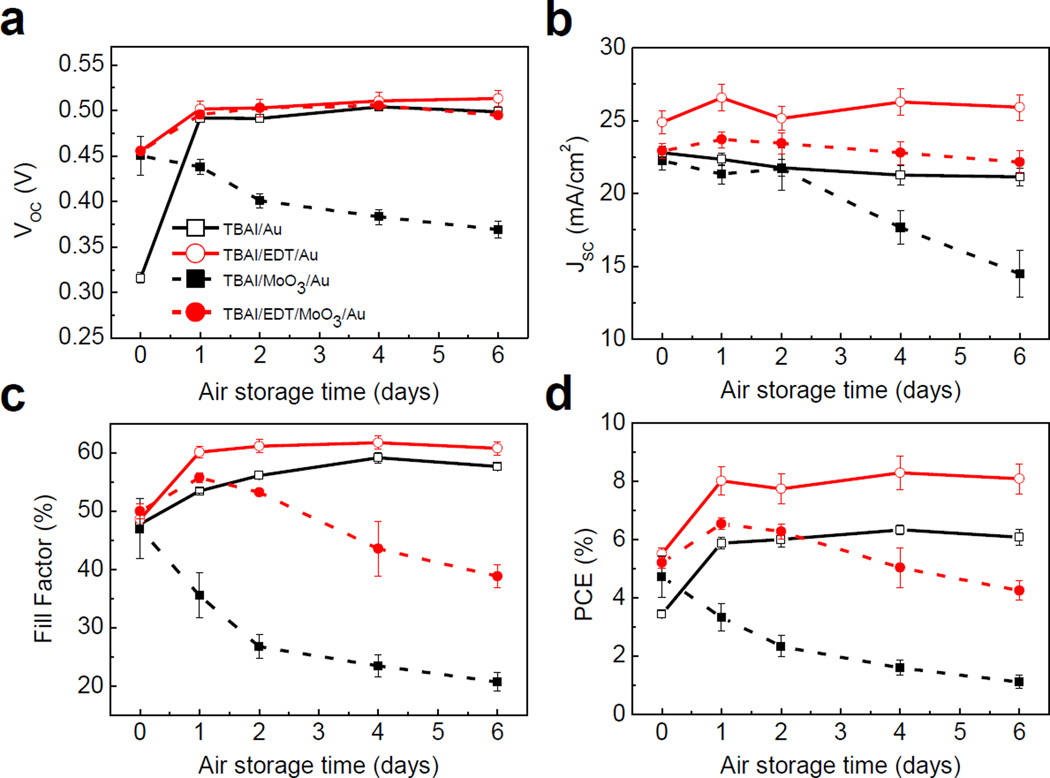
Figure 3. Evolution of photovoltaic parameters with air storage time in devices with Au and MoO3/Au anodes.
a, VOC. b, JSC. c, FF. d, power conversion efficiency (PCE). Measurements were performed in a nitrogen-filled glovebox. Day 0 denotes measurements performed after anode evaporation in vacuum. Between each measurement, the unencapsulated devices were stored in air without any humidity control. The average (symbols) and standard deviation (error bars) were calculated based on a sample of between 6 and 9 devices on the same substrate.

