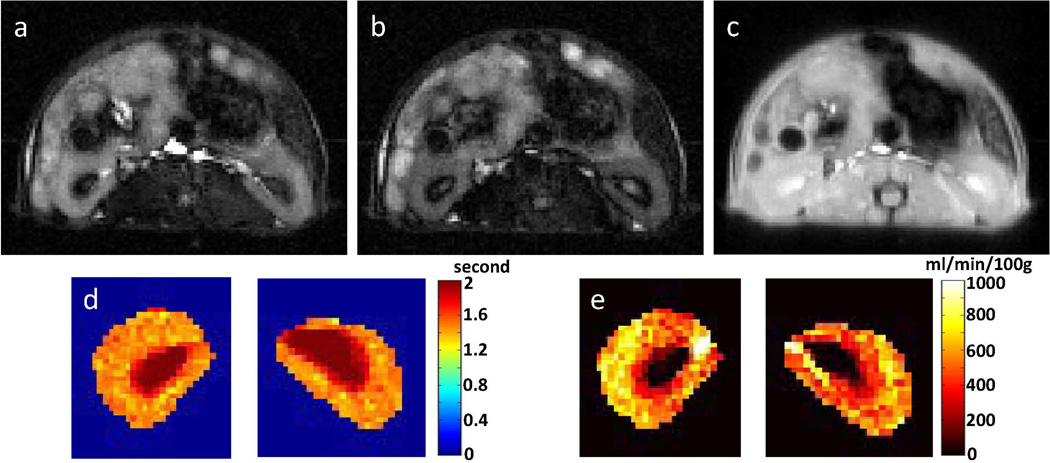
Figure 6.
Kidney ASL-FISP images from a healthy C57/BL6 mouse at 7 T. (a) Slice-selective (bright-blood) and (b) non-selective (dark blood) ASL-FISP images; (c) M0 FISP image (no inversion); (d) Look-Locker T1 map; and (e) perfusion map. Renal arteries (high perfusion) and renal medulla (low perfusion) are clearly visible in the perfusion map.

