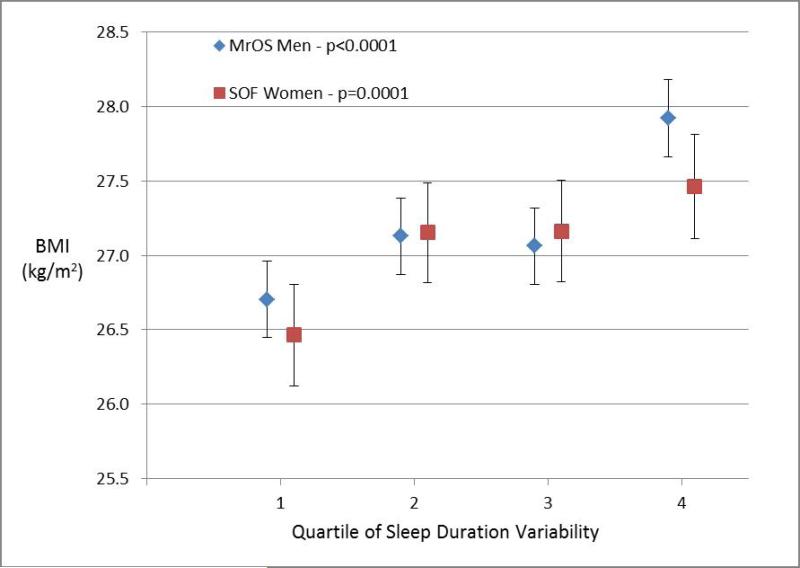
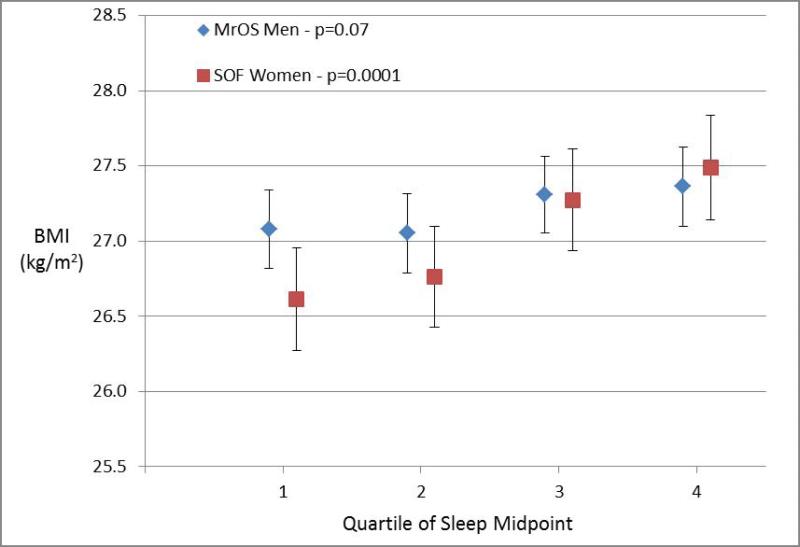
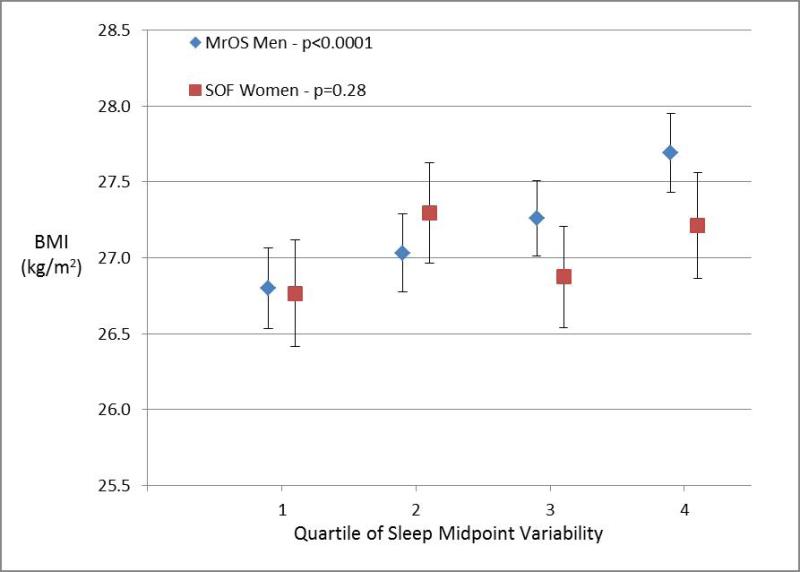
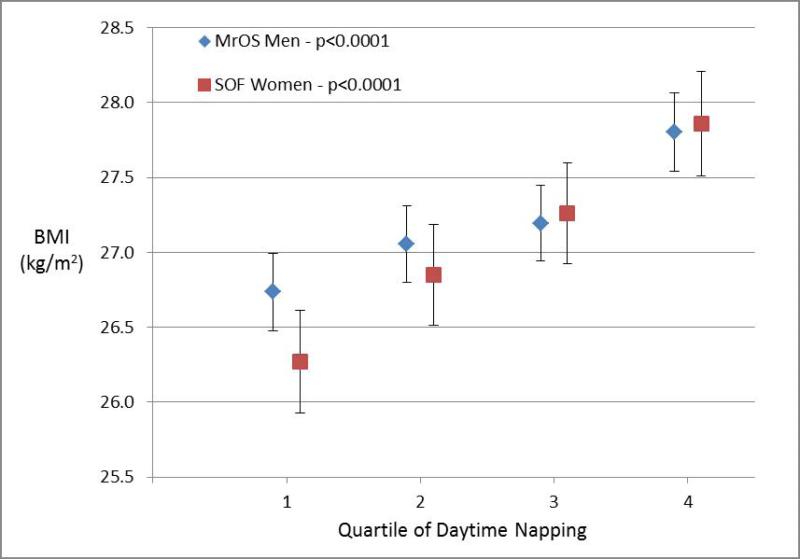
Figure 1. Body Mass Index by Sleep Measures.
Mean body mass index (BMI) plotted by quartile of sleep measure among men in MrOS and women in SOF cohorts adjusting for age, site, race, education, history of diabetes, stroke, coronary artery disease, heart failure, antidepressant use, benzodiazepine use, smoking, alcohol, caffeine, exercise, depression, cognitive function, self-reported health, and mean nocturnal sleep duration. The association with sleep duration variability is shown in Panel 1a, sleep midpoint in Panel 1b, sleep midpoint variability in Panel 1c, and time spent napping in Panel 1d. P-values are based on a test of trend.


