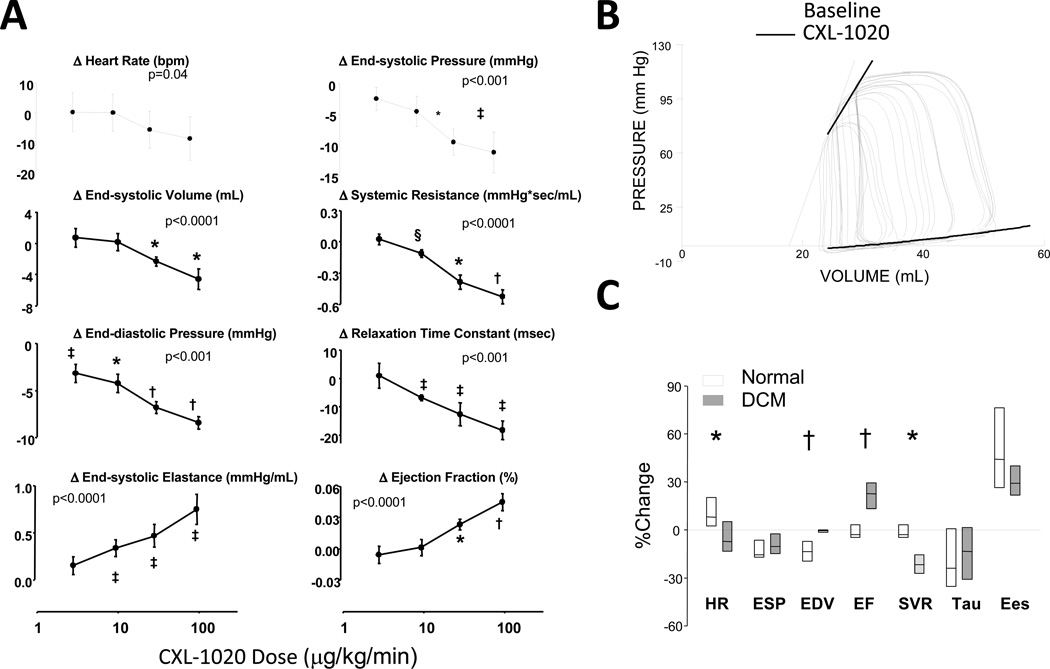
Figure 4. Influence of CXL-1020 in conscious heart failure dogs.
A) Absolute change in hemodynamic parameters in Group 2 (conscious) heart failure dogs as a function of increasing CXL-1020 dose. P-values in each plot are for a repeated measures analysis of co-variance (with drug dose as the continuous variable, n=5). Post-hoc multiple comparisons test for dose response versus baseline: * - p<0.005; † - p<0.001; ‡ - p≤0.01; § - p=0.02. B) Example pressure volume loops at baseline and after CXL-1020 infusion, showing an increase in the slope of the end-systolic pressure volume relationship (solid line is control, dashed after CXL-1020). C) Box-plot for percent change in hemodynamic parameters before and after 100 mg/kg/min CXL-1020 in normal dogs and the same dogs after inducing heart failure. * - p<0.05, † p<0.01 between groups (n=5 per group, Kruskal-Wallis used to test for effect of heart failure on the response).

