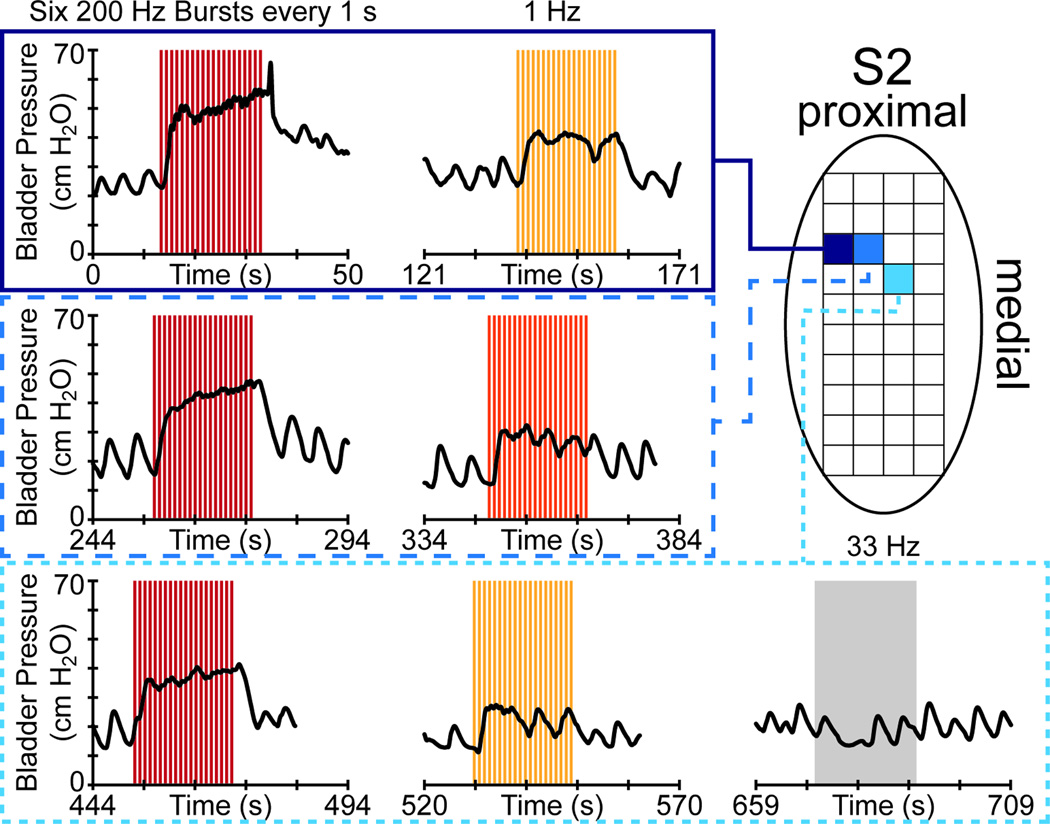
Figure 3.
Stimulation-evoked bladder excitation sustained for twenty seconds in a single DRG (S2) during experiment 4. The stimulation pattern is given at the top of each column of trials, with each row reflecting stimulation on a single electrode. In these trials, a bursting stimulus pattern led to larger contractions than 1 Hz or 33 Hz patterns. The stimulation amplitude was fixed at 30 µA in each trial. The colors for each stimulation trial period reflect the PEV, based on the Figure 2 legend.

