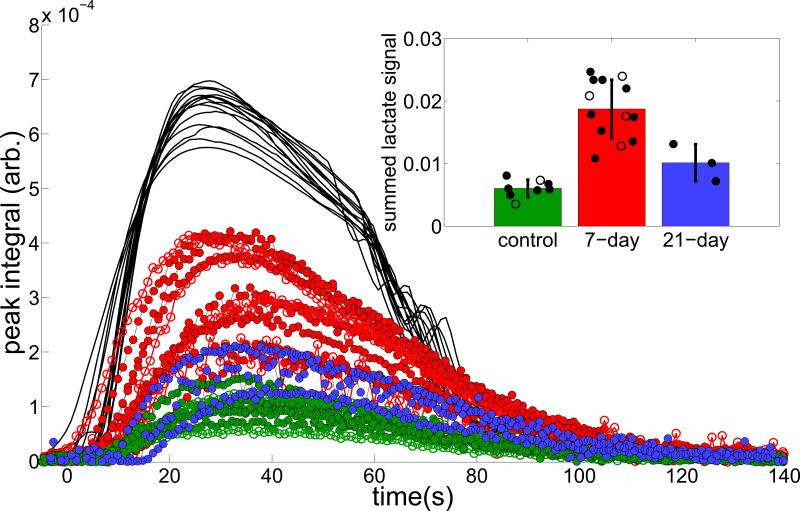
Figure 2.
Shows the full time-series of fit peak areas, in which the 7-day inflammatory group lactate peaks exceed those of the control group at all times, by an average factor of 3.3. Note that the signal amplitudes are scaled such that the sum of pyruvate areas Σp(t) = 1, and times are shifted such that each injection is centered around t = 50. The inset bar graph shows the mean and average integrated lactate signal in the control (green), 7-day (red) and 21-day (blue) groups. In both plots, solid circles represent data acquired on the first 13C injection and open circles represent data acquired on the second 13C injection. When only first injections are considered, the 7-day group is statistically distinguishable from the other two groups (p = 0.0003). Although only six studies were repeated, no systematic change is evident (visually or by repeated measures ANOVA) between the groups due to the time delay between the two HP agent injections.

