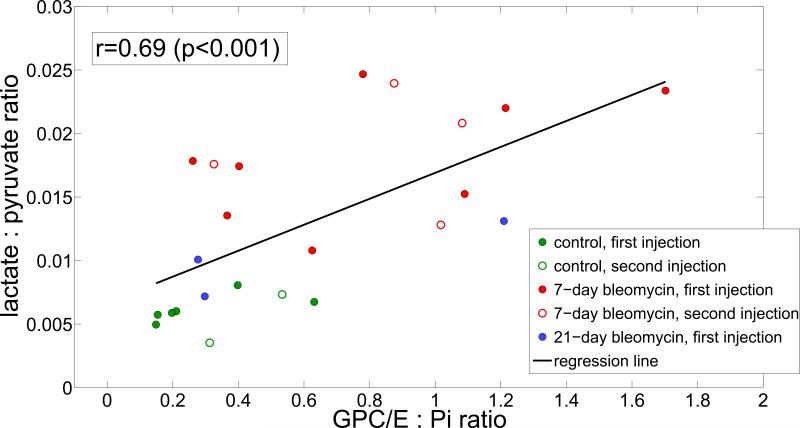
Figure 5.
Among all lungs, the increase in lactate produced by inflamed lungs is significant (approximately a factor of 3.3 at 7 days and a factor of 1.8 at 21 days) and correlates moderately well to the GPC/GPE peak increase observed using time-averaged 31P spectroscopy of the lung. In the figure, the cohorts are distinguished as: control (green), 7-day (red) and 21-day (blue) cohorts. First and second injections in the same lung are distinguished as closed and open circles, respectively.

