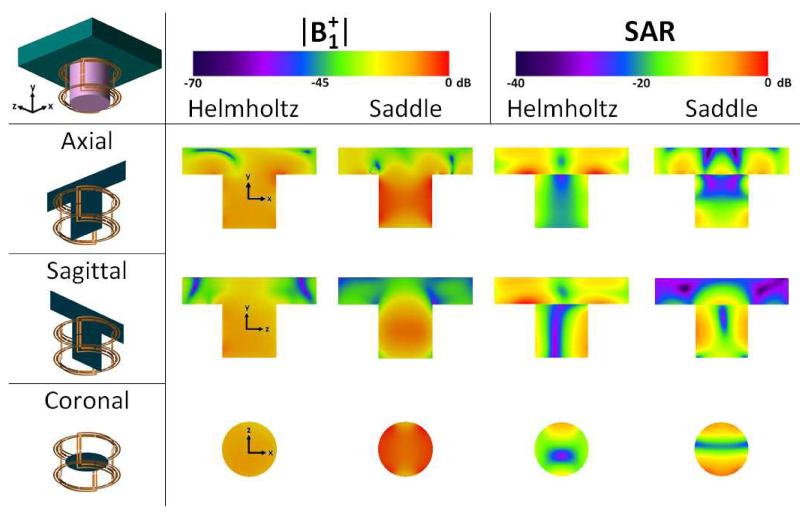
Figure 4.
|B1+| and SAR field plots generated by Remcom XFdtd. The phantom is a 12.0 cm diameter, 12.0 cm tall cylinder with the nominal properties of breast tissue connected to a 30.0 × 30.0 × 6.0 cm slab assigned the properties of muscle tissue, as described in the text. |B1+| plots demonstrate the homogeneity provided by the FCE design despite asymmetric loading. Asymmetries in the SAR plot are due to the feed locations on the Helmholtz and saddle pairs, as described in the text. The Helmholtz and saddle pairs were each normalized to 1 watt net input power. 0 dB corresponds to 2.0 μT and 1.47 W/kg in the |B1+| and SAR figures, respectively.

