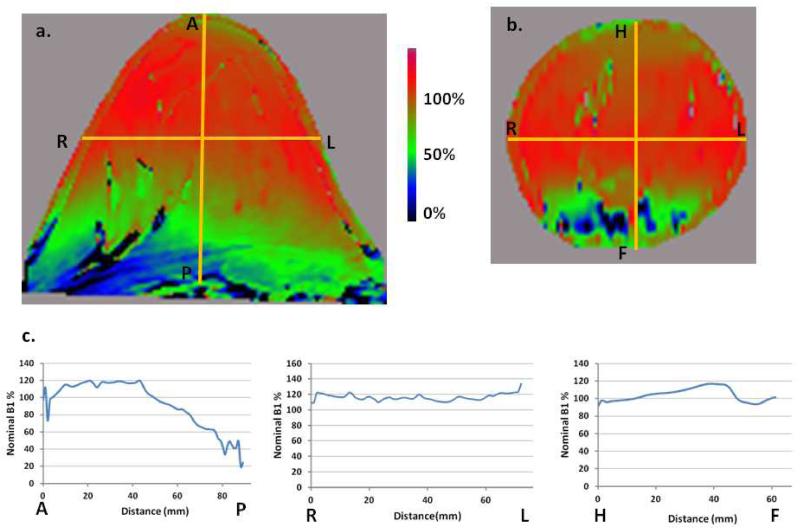
Figure 6.
B1+ map of a healthy volunteer. Power optimization was performed on the shim volume that included most of the breast volume proper. The nominal tip angle was 50 degrees and B1+ is shown as a percentage of that. (a) B1+ in the transverse plane as a percentage of nominal B1+. (b) B1+, coronal view. (c) B1+ AP, RL, and FH line profiles corresponding to the yellow lines in 6(a) and 6(b). The AP profile indicates approximately 1 cm penetration into the chest wall. The coefficient of variation of B1+ in AP direction in the breast tissue is approximately 20% in this case due to the posterior side of the breast extending outside the coil. The RL and HF profiles exhibit much smaller variations, 4% and 7%, respectively. The location of the HF profile line was chosen specifically to avoid the large anatomical null in the bottom center of the image.

