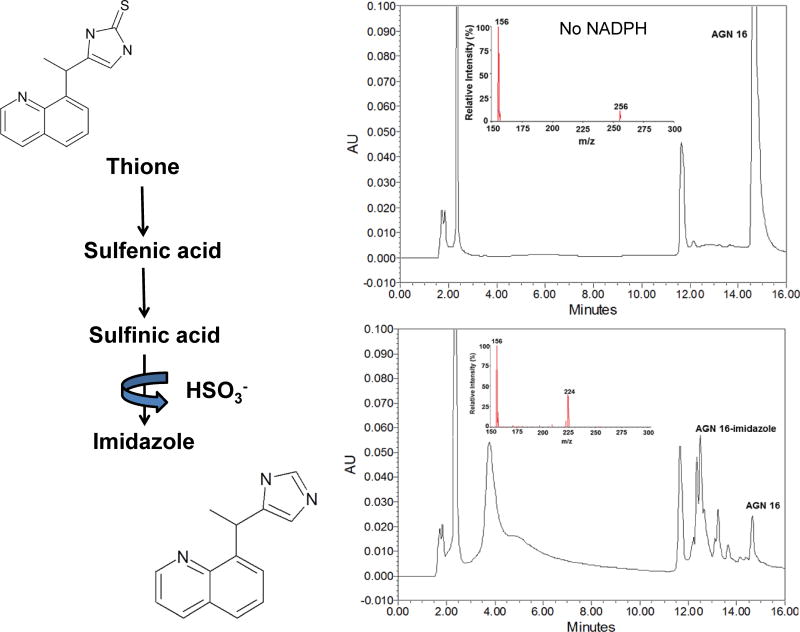
Figure 6.
HPLC-MS Analysis of hFMO1 Conversion of the Thione AGN 16 to the Imidazole
LC-MS/MS analysis of hFMO1 conversion of the thione AGN 16 to the imidazole. HPLC chromatogram of AGN 16 (top right panel) with corresponding MS spectra (m/z 256), following incubation with expressed hFMO1. Addition of NADPH (bottom right panel) converts most of the parent compound (14.8 min peak) to slightly more polar compounds (12.5 min peak; MS spectra m/z 224), consistent with the loss of S.

