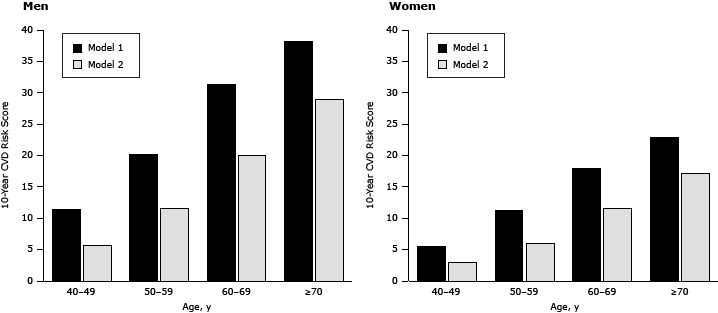
Figure.

The means of 10-year general cardiovascular disease (CVD) risk scores calculated by using the Framingham equation (20, 21) with body mass index (model 1), and Model 1 plus modified risk factors (smoking, systolic blood pressure, and body mass index) (model 2), by age and sex.
| Sex/Age, y | General Cardiovascular Risk Mean Score |
|||
|---|---|---|---|---|
| Men |
Women |
|||
| Model 1 | Model 2 | Model 1 | Model 2 | |
| 40–49 | 11.4 | 5.8 | 5.5 | 3.0 |
| 50–59 | 20.2 | 11.7 | 11.2 | 6.0 |
| 60–69 | 31.4 | 20.0 | 18.0 | 11.6 |
| ≥70 | 38.3 | 29.0 | 22.9 | 17.2 |
