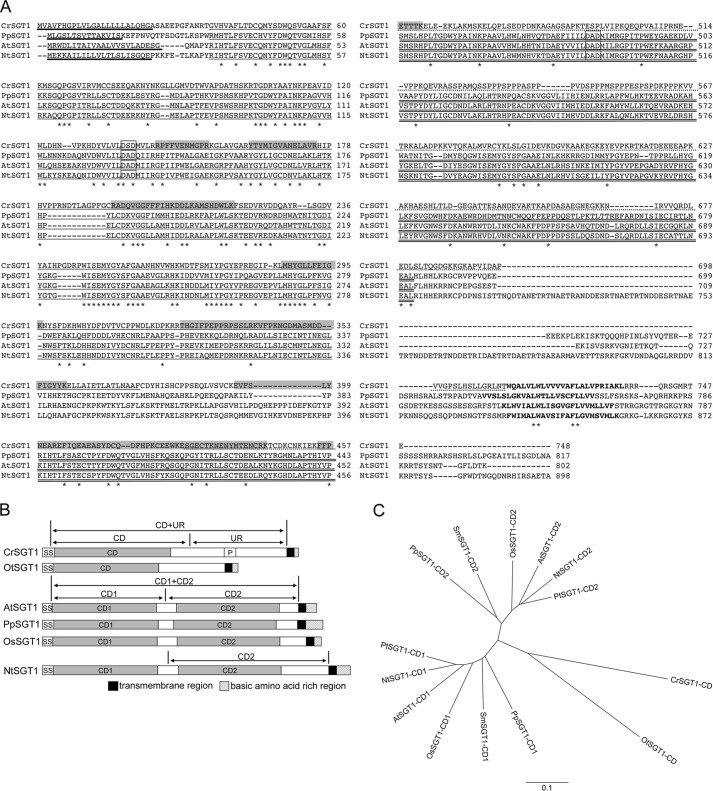
FIGURE 4.
A, alignment of predicted amino acid sequences of SGT1. In the CrSGT1 sequence, shaded areas indicate the peptides identified from the MS/MS analysis of the band shown in Fig. 3B. Boldface letters indicate transmembrane regions near the C terminus. Single and double lines indicate catalytic domains (CD1 and CD2, respectively). Broken lines indicate unknown regions (UR) in CrSGT1. Thick lines indicate signal sequences. Squares indicate the consensus DXD motif. Asterisks indicate conserved amino acid residues. The alignment was performed using the ClustalW2 program (67). B, schematic of domain structures of SGT1 protein of various species. SGT1s, including putative domains, of six species are shown. SS, signal sequence; CD, catalytic domain; P, proline-rich region; and UR, unknown region. Regions indicated by the arrows on CrSGT1, AtSGT1, and NtSGT1 were expressed as recombinant proteins by P. pastoris. C, phylogenic tree of catalytic domains in SGT. The phylogenic tree was calculated using the ClustalW2 program (67) and drawn by FigTree version 1.3.1 program. At, A. thaliana (NCB accession number NP_566148); Cr, C. reinhardtii (NCB accession number BAL63043); Nt, N. tabacum (NCB accession number BAL63045); Os, O. sativa (NCB accession number NP_001045124); Ot, O. tauri (NCB accession number XP_003074419); Pp, P. patens (NCB accession number XP_001775943); Pt, P. trichocarpa (NCB accession number XP_002298591); and Sm, S. moellendorffii (NCB accession number XP_002969342).

