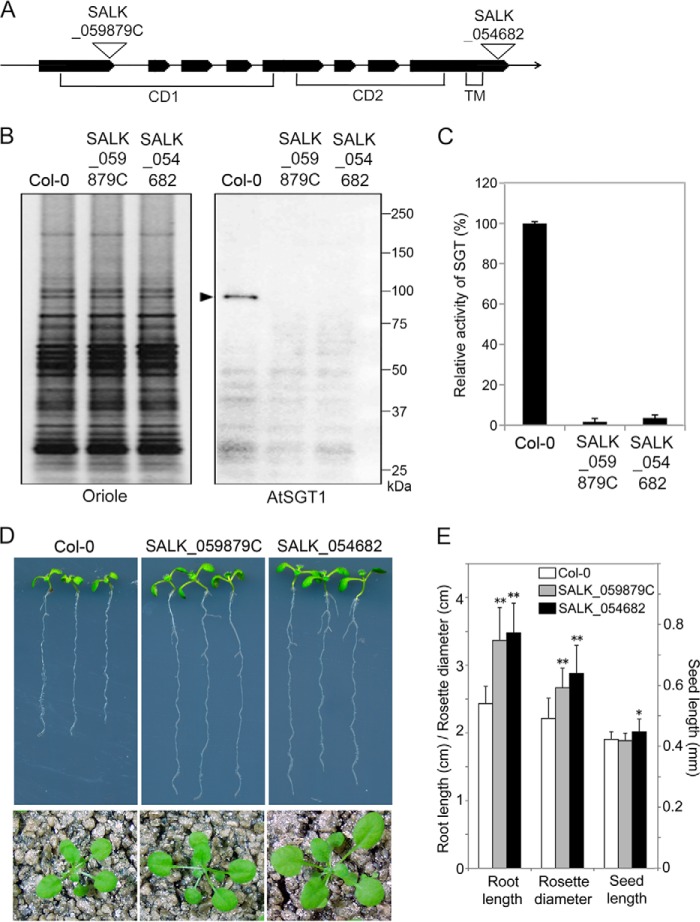
FIGURE 8.
Analysis of AtSGT1 mutant cells. SALK_059879C and SALK_054682 have tDNA insertion mutations in the AtSGT1 gene. A, insertion position of tDNA in SALK_059879C and SALK_054682. An arrow shows the genome region of AtSGT1 schematically; bold lines and thin lines represent exons and introns, respectively. CD1 and CD2 indicate catalytic domains, and TM indicates a transmembrane region. B, biochemical analyses of AtSGT1 mutant cells. P10 fraction (5 μg) from Col-0 and AtSGT1 mutant cells were separated by SDS-PAGE. Oriole shows proteins stained using Oriole fluorescent gel stain. AtSGT1 shows Western detection using anti-AtSGT1 antibody. A black arrowhead indicates AtSGT1 protein. C, SGT activity was assayed with 100 μg of P10 fractions from Col-0 and AtSGT1 mutant cells incubated with AtEXT peptide as an acceptor for 10 h at 30 °C, and the amount of SGT product was analyzed by HPLC. 100% corresponds to 3.0 × 10⁻³ unit (nmol/min/mg protein) in assay with 100 μg of P10 fraction from Col-0 (mean ± S.D.; n = 3). D, 8-day-old seedlings on solid Murashige and Skoog medium containing 3% sucrose and 0.8% agar (upper panels) and 3-week-old plants on soil (lower panels). E, comparison of root length of 8-day-old seedlings (mean ± S.D.; n = 8), rosette diameter of 3-week-old seedlings (mean ± S.D.; n = 15), and seed length (mean ± S.D.; n = 30) of Col-0 and AtSGT1 mutants. *, p < 0.01, and **, p < 0.0005, indicate significant differences from Col-0.

