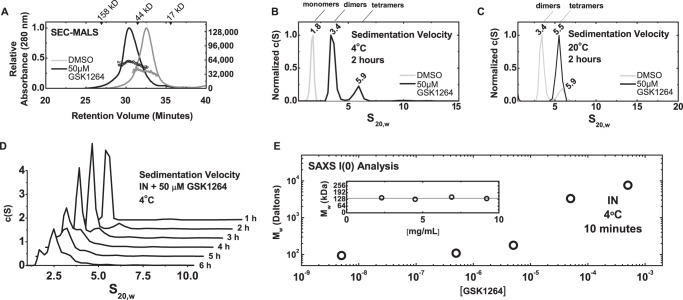
FIGURE 4.
Multimerization of HIV-IN induced by GSK1264. A, aggregation of INQ as a function of drug concentration. Shown is SAXS I(0) analysis of the weight-averaged mass of INQ solutions at a 5-mg/ml concentration as a function of drug concentration. These measurements were recorded over 10-min time courses at 4 °C immediately after the addition of drug or DMSO. I(0) calculations were relative to a to a standard curve of nine proteins of known mass and concentration (supplemental Fig. 2). Shown in the inset are mass determinations for INQ solutions at four different concentrations. B and C, sedimentation velocity analysis. c(S) analysis of sedimentation velocity data is shown for full-length 30 μm INQ at 4 °C (B) and 20 °C (C) in the presence of DMSO (gray) or 50 μm drug (black) is shown. Species assigned as monomers (∼1.8 S), dimers (∼3.4 S), and tetramers (∼5.5 S) are denoted. Distributions were derived from the fitting of the Lamm equation to the experimental data collected in the first 2 h of the experiment, as implemented in the program SEDFIT (70). D, time-dependent loss of soluble mass evidenced by sedimentation velocity analysis. Distributions derived using different time ranges of data recorded. Seen is a diminution of the ∼3.4 S species (dimers) coinciding with the loss of overall soluble mass (as evidenced by a decrease in the area under the curve). E, representative SEC-MALS analysis. Shown as lines are the absorbance profiles (left axis) of INQ samples injected at 100 μm after a 30-min incubation at room temperature with either DMSO (gray) or 200 μm drug (black), as a function of elution time from a Superdex-200 10/300 column at room temperature. The peak eluent is at ∼0.1 mg/ml concentrations, as determined by refractive index. Corresponding circles denote molecular masses determined by in-line light scattering (right axis) in Da. An IN monomer has a predicted molecular mass of ∼32 kDa.

