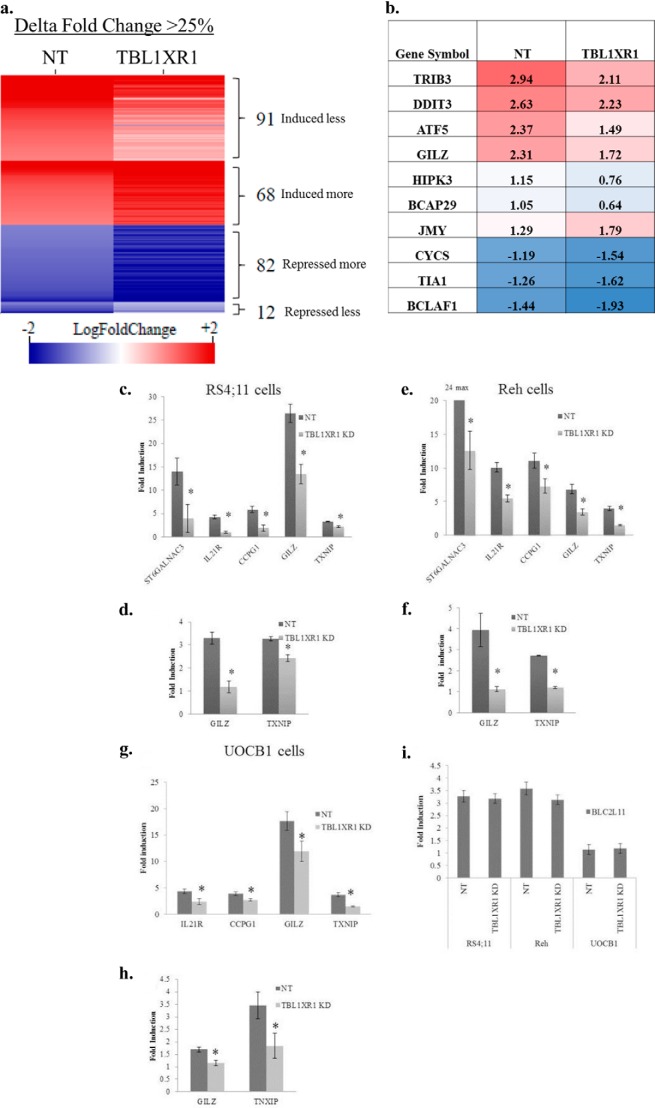
FIGURE 5.
a, heat map of altered genes induced/repressed by at least 2-fold (log fold change ≥±1) in prednisolone-treated cells as compare with vehicle-treated cells. Red indicates genes that are induced by prednisolone and blue indicates genes that were repressed upon prednisolone exposure. Log fold change values corresponding to nontargeting (NT) and TBL1XR1 cells are represented by the left and right columns, respectively. All of the genes represented in the heat map have at least 25% difference (Δ fold change) in their transcriptional response to prednisolone between NT and TBL1XR1 knockdown lines. b, fold induction or repression represented in a log scale of genes involved in apoptosis in the NT and TBL1XR1 knockdown lines. c, e, and g, fold induction of steady state RNA levels of prednisolone-induced genes ST6GALNAC3, IL21R, CCPG1, GILZ, and TXNIP in control and TBL1XR1 knockdown, RS4;11 (c), Reh (e), and (g) UOCB1 cells treated with 500 μg/ml prednisolone for 8 h. d, f, and h, fold induction of nascent RNA levels of GILZ and TXNIP in control and TBL1XR1 knockdown RS4;11 (d), Reh (f), and UOCB1 (h) cells treated with 500 μg/ml prednisolone for 8 h. i, induction of BLC2L11 (Bim gene) in Reh, RS4;11, and UOCB1 control and knockdown cell lines. Error bars represent standard deviations. *, significant change with a p value less than or equal to 0.05. Experiments were replicated at least three times.

