
FIGURE 2.
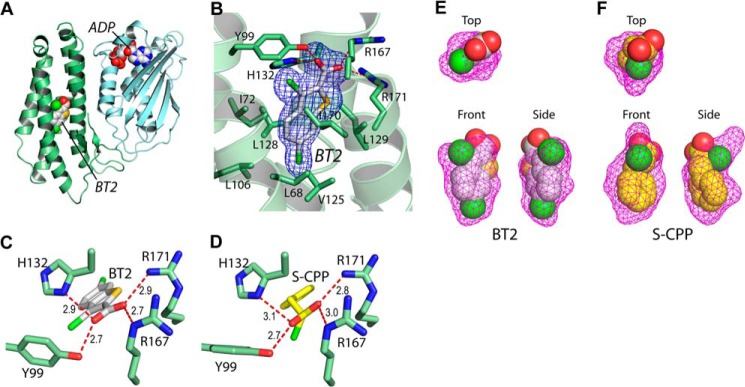
Crystal structures of rat BDK in complex with BDK inhibitors BT2 and (S)-CPP. A, bound BT2 and ADP (in the space-filling model) in the N-terminal domain (green) and C-terminal domain (cyan), respectively, of a BDK monomer. B, the Fo − Fc omit density map of bound BT2 in the allosteric site. C and D, hydrogen bonding networks of bound BT2 and (S)-CPP, respectively, in the allosteric site. E and F, surface maps of the allosteric pocket harboring BT2 and (S)-CPP, respectively.