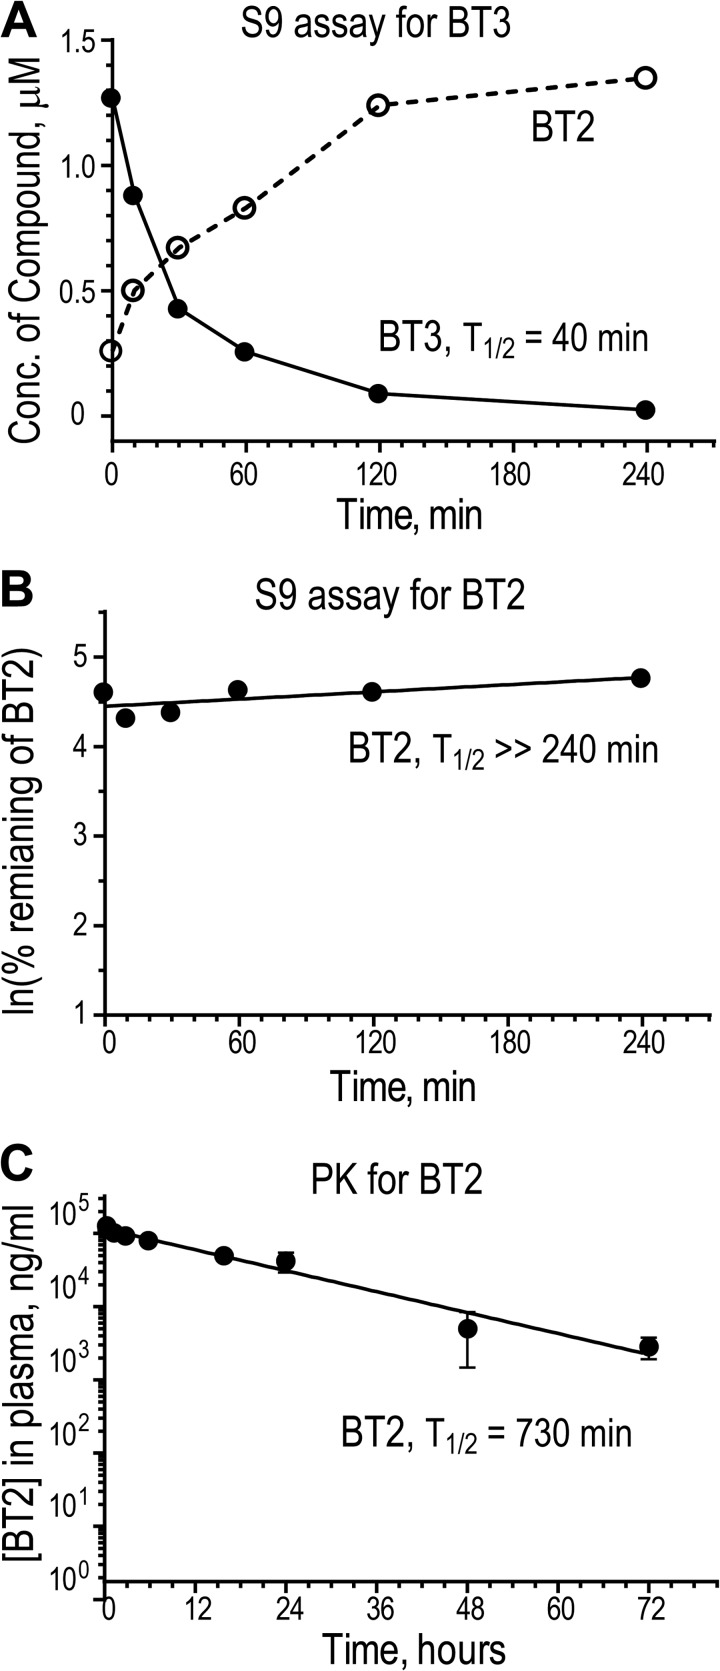
FIGURE 4.
Metabolic stability and pharmacokinetics of BT2 and BT3. A, metabolic stability of BT3 in S9 fractions. BT3 (2 μm) was incubated with S9 factions; concentrations of BT3 and BT2 in aliquots taken at different time points were determined by LC-MS/MS. B, metabolic stability of BT2 in S9 factions. The remaining BT2 levels at different time points were determined by LC-MS/MS and expressed as ln(percentage of initial BT2 concentration). C, pharmacokinetics of plasma BT2 depletion. BT2 (10 mg/kg) was administered to CD-1 male mice by intraperitoneal injection. Plasma was collected from different time points (n = 3). BT2 concentrations were determined by LC-MS/MS. ns, not significant; *, p < 0.05; **, p < 0.01; ***, p < 0.001; ****, p < 0.0001 when compared with the group treated with DMSO. Error bars, S.D.

