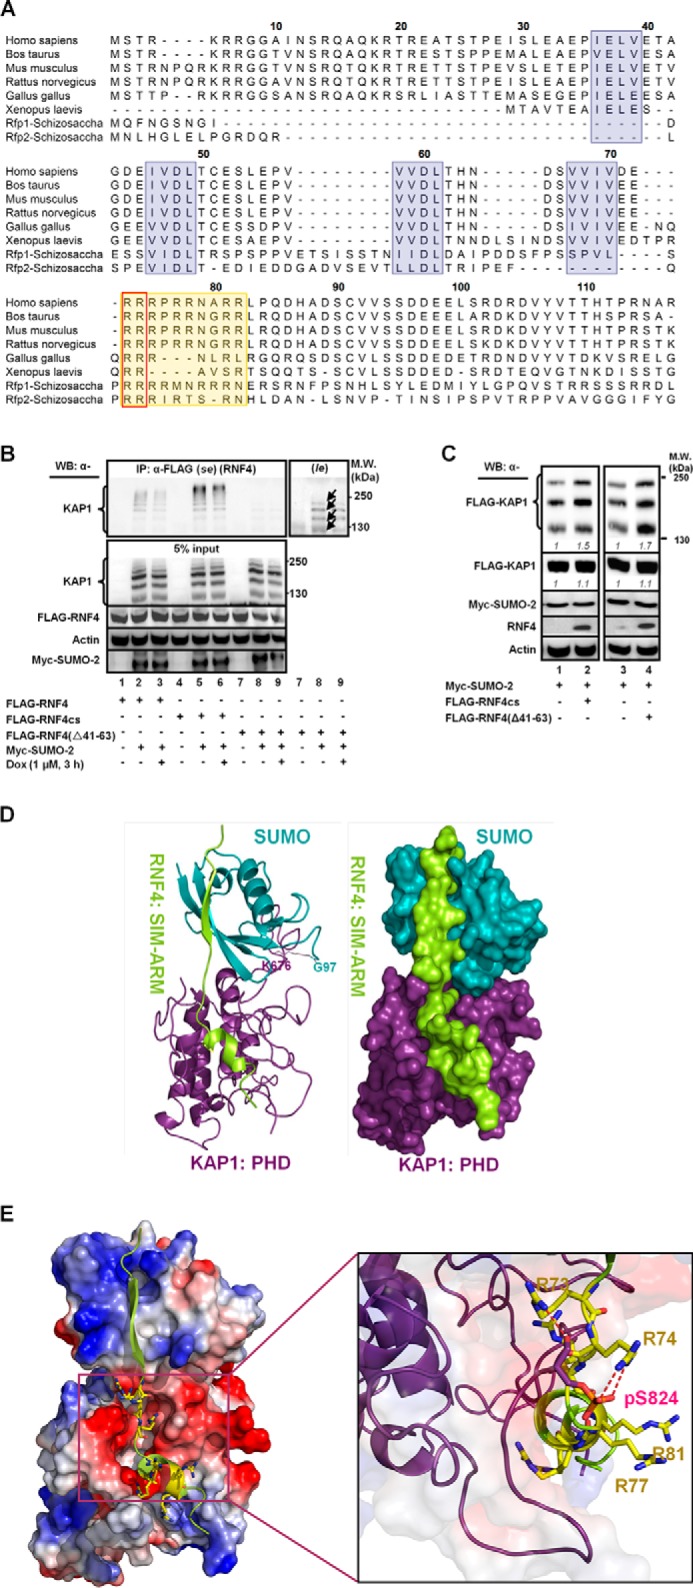
FIGURE 4.

The ARM and SIMs are important motifs for RNF4 to selectively target its substrates. A, the conserved SIM and ARM domains are shaded. SIMs are blue, the ARM is orange, and Arg-73/74 are boxed. B, HEK293 cells were transfected with Myc-SUMO-2 and FLAG-RNF4(WT, cs, or Δ41–63) and treated with Dox. Proteins were immunoprecipitated (IP) with an anti-FLAG antibody to analyze the FLAG-RNF4-associated complex. Endogenous KAP1 and levels of input control were visualized using the appropriate antibodies. se, short exposure; le, long exposure. WB, Western blot; MW, molecular weight. C, overexpressing the ligase-dead RNF4 (RNF4cs) or RNF4 with the SIMs deleted (RNF4(Δ41–63)) causes the accumulation of SUMO-KAP1. HEK293 cells were transfected with FLAG-KAP1, Myc-SUMO-2, and FLAG-RNF4cs or RNF4(Δ41–63) and then treated with Dox for 3 h. The relative levels of SUMO-KAP1 and FLAG-KAP1, after they were normalized to actin, are shown in italics. The relative levels in the control cells cotransfected with vector were set to 1. D, ribbon structure of the complex formed by the interaction of SUMO-KAP1 with the fourth SIM and the ARM of RNF4. SUMO is colored cyan, KAP1 is purple, and RNF4 is yellow (left panel). The isopeptide bond formed between the Gly-97 of SUMO and Lys-676 of KAP1 is shown in line. The representative surface of the complex is shown in the right panel using the same color schemes as in the left panel. E, a molecular docking model for the RNF4·Ser(P)-824·SUMO·KAP1 complex. Shown is the positioning of the SIM and the ARM on the electrostatic surface of Ser(P)-824-SUMO-KAP1 (red, negatively charged; blue, positively charged). The residues in the ARM of RNF4 are represented by sticks (left panel). The magnified region shows the interaction of Ser(P)-824 of KAP1 with the arginines in the ARM of RNF4. The interacting residues are represented by sticks. Negatively charged groups are red, and positively charged groups are blue. Hydrogen bonds are indicated by dotted red lines (right panel). B and C, one representative Western blot is shown (n = 3).
