
FIGURE 10.
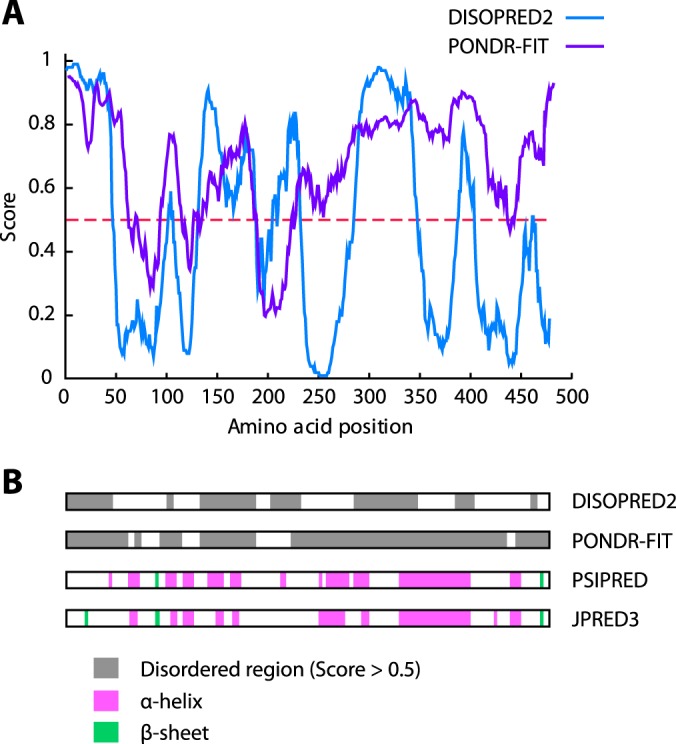
Bioinformatic analyses of PICT1 protein for disorder and secondary structure predictions. Regions of disorder were predicted with DISOPRED2 and PONDR-FIT. A, results are represented by blue (DISOPRED2) and purple (PONDR-FIT) lines. B, disordered regions (gray box) were represented with results of secondary structure prediction with PSIPRED (46) and JPRED3 (47). Pink and green boxes represent α-helix and β-sheet, respectively.