FIGURE 2.
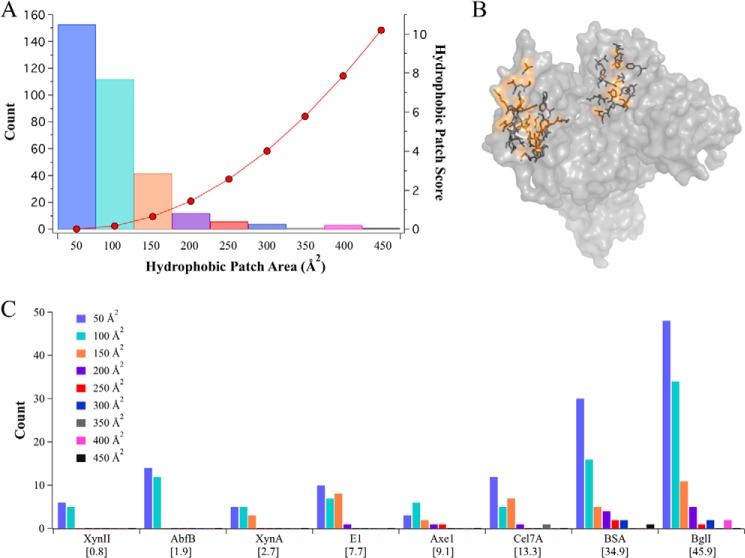
The hydrophobic patch score broken down by the number and size of identified patches for each enzyme suggests a minimum patch size for preferential lignin adsorption. A, the individual hydrophobic patch score for each bin size is shown with red dots (right y axis). The count for each hydrophobic patch size found in the investigated set of proteins is shown with bars (left y axis). B, a surface representation of BSA with two of the four largest identified hydrophobic patches highlighted in orange, and side chains are shown in stick representation. C, the hydrophobic patch scores for each protein are listed in brackets under the protein name under the x axis. The count for each hydrophobic patch size is broken down for each protein. The patch sizes are binned by Å2 of solvent-accessible surface area. Larger patches (>350 Å2 of SASA) are only observed on A. niger BglI and BSA. Because the score increases exponentially for each bin size, the larger hydrophobic patch scores seen in BglI and BSA are explained by the presence of larger hydrophobic patches.

