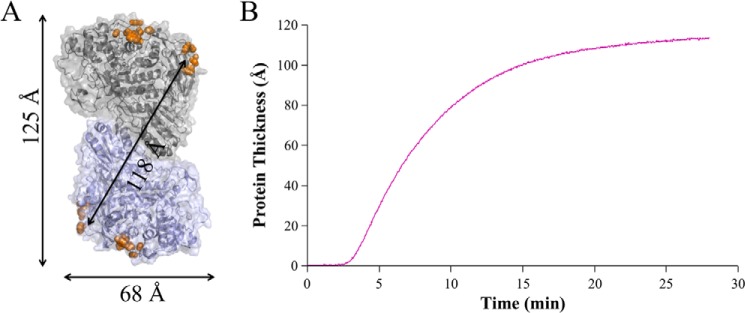
FIGURE 5.

The distance of the dimeric structure between hydrophobic patches on A. niger BglI agrees with the thickness of the deposited protein layer as evaluated with QCM-D. A, the modeled BglI dimer is shown in cartoon and surface representation with the four largest hydrophobic patches highlighted with orange spheres. Distances between the hydrophobic patches (125 and 118 Å) are shown with arrows, and the monomer thickness across the short axis is shown below (68 Å). B, the estimated thickness of the BglI protein layer on the lignin surface is shown. The first 3 min is the flow of buffer only, followed by 25 min of protein injection.
