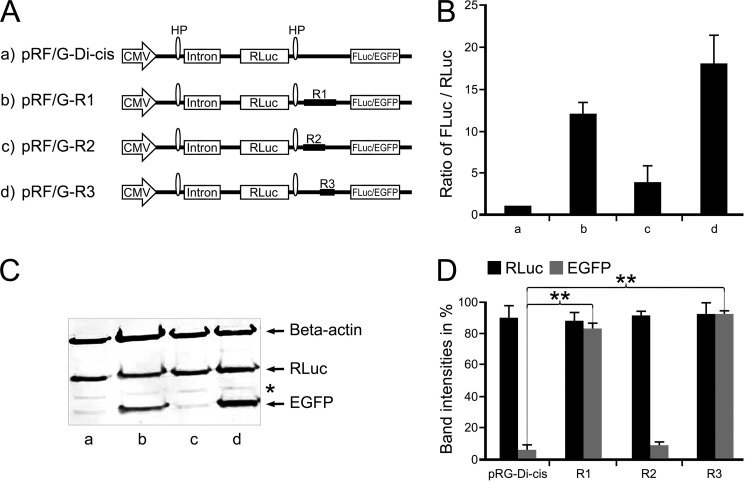
FIGURE 2.
Identification of IRES activity in the coding region of Cx43 using Di-cis vectors. A, schematic view of the Di-cis constructs with Renilla gene as first cistron and either firefly luciferase (FLuc for luciferase data) or EGFP (for Western blot) as second cistron. a, pRF/G-Di-cis (control vector); b, pRF/G-R1 Di-cis construct (R1) (contains coding region from nt 1 to 637; c, pRF/G-R2 Di-cis construct (R2) (contains coding region from nt 1 to 442); d, pRF/G-R3 Di-cis construct (R3) (covering the region from nt 442 to 637). B, IRES activity of the above constructs in NIH3T3 cells. IRES activity is represented as the ratio of firefly to Renilla luciferase luminescence (FLuc/RLuc), with the luminescence of the control vector pRF-Di-cis set at 1. R1 enhances IRES activity by about 12-fold (column b), as compared with vector alone (column a); fragment R2 shows minimal (2–3-fold) luminescence of the FLuc/RLuc ratio (column c). Maximal expression (17-fold) of FLuc was achieved with fragment R3, which contains the nucleotide segment nt 442–637 (column d). C, Western blot of the above Di-cis constructs (with EGFP as second cistron) transiently transfected into NIH3T3 cells. The expression of EGFP corroborates the pattern as found with the dual luciferase assay (shown in B). Fragment R1 (lane b) and fragment R3 (lane d) enhance the expression of the second cistron (EGFP) appreciably, as compared with control vector (lane a) and fragment R2 (lane c). Note that the β-actin protein band (probed in the same gel) represents equal loading of protein samples, and expression of the first cistron (i.e. Renilla luciferase (also probed in the same gel) (RLuc)) remains almost similar in all constructs. D, quantitative assessment of three different Western blots, as shown in Fig. 2C. Each experiment was performed five times with constructs in triplicates. Asterisk, nonspecific protein band. Data are expressed as mean ± S.E. (error bars); **, p < 0.01.

