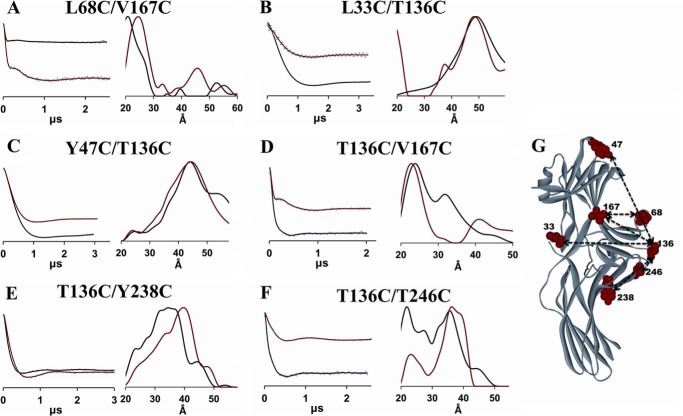
FIGURE 4.
DEER analysis of the movement of the finger loop and the loop containing residue 136. Fits to the free (black) and PR*-bound (red) background-corrected dipolar evolution data (gray dots) are plotted on the left for the finger loop (A) and the loop containing residue 136 mutants (B–F) to illustrate the data quality and support the distance distribution data. The corresponding distance distributions are shown on the right as overlays for the free (black) and PR*-bound (red) states. G, the positions of the spin labels are shown as red CPK models on the crystal structure of the free state (PDB entry 1G4M) of arrestin-2. Measured distances are shown as dotted lines.

