
FIGURE 6.
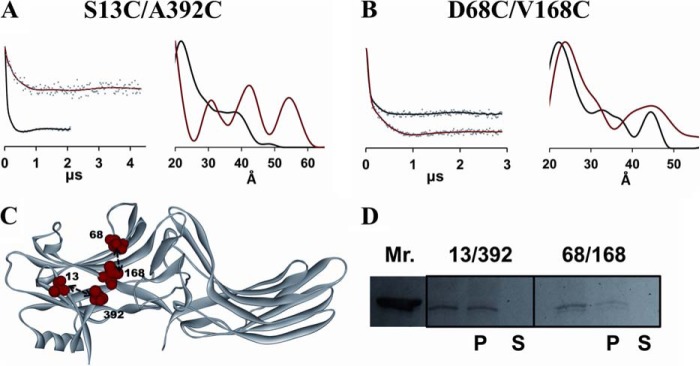
A and B, DEER analysis for two arrestin-3 spin-labeled double mutants. Fits to the free (black) and PR*-bound (red) background-corrected dipolar evolution data (gray dots) are plotted on the left to illustrate the data quality and support the distance distribution data. The corresponding distance distributions are shown on the right as overlays for the free (black) and PR*-bound (red) states. C, the free state crystal structure of arrestin-3 (PDB entry 3P2D) is labeled with the double mutants (red spheres) used for the DEER study. D, pull-down assay results for the spin-labeled arrestin-3 protein pairs.