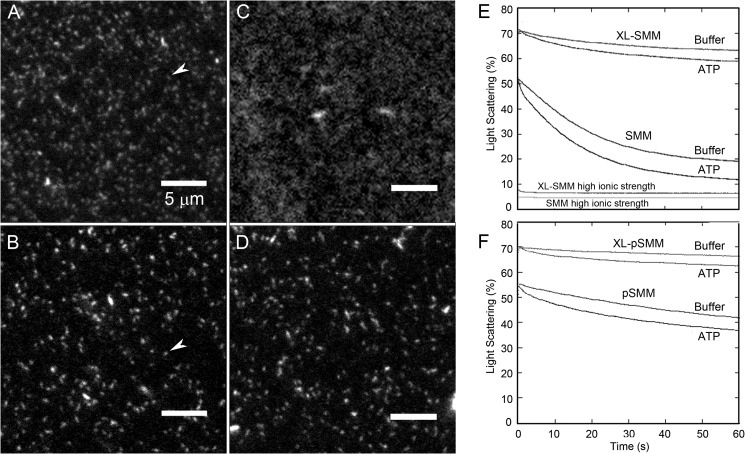
FIGURE 3.
Assessment of SMM filament stability. A–D, imaging of SMM filaments by TIRF microscopy. Rh-SMM (A) or XL-Rh-SMM (B) at 100 μg ml−1 in filament buffer was added to a bare glass flow cell followed by imaging filament buffer. White arrows indicate single filaments. Rh-SMM (C) and XL-Rh-SMM (D) filaments are as in A and B except that 1 mm ATP was added to the flow cell after filament binding to the surface. Notice that the XL-Rh-SMM filaments retain their structure in the presence of ATP (D), whereas the Rh-SMM filaments (C) largely depolymerize. The smallest structure resolvable is 106 nm long (1 pixel). E and F, dilution-induced SMM filament depolymerization. Light scattering was monitored with excitation and emission at 406 nm with no emission filter. All proteins were assayed at 1 μm heads (final concentration). ATP was removed from phosphorylated samples (see “Experimental Procedures”). Light scattering transients after rapidly mixing 2 μm SMM heads with an equal volume of filament buffer with or without 100 μm ATP (final [ATP] = 50 μm). E, XL-SMM (top two traces) and SMM (middle two traces). Traces at bottom labeled high ionic strength are shots against a 50 mm MOPS, pH 7.0, 500 mm KCl without ATP (final concentration, 0.25 m KCl) The process was essentially too fast to measure within the dead time of the instrument. F, XL-pSMM (top two traces) and pSMM (bottom two traces). Experiments were performed in filament buffer at 25 °C. The data in E and F reflect the raw data and were not normalized in any way.

