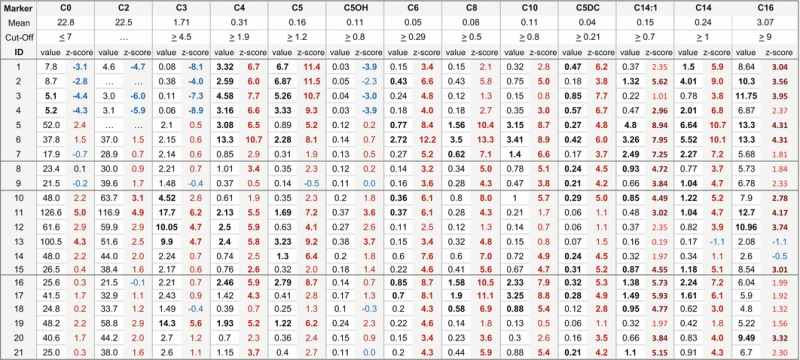
Table 2.
Concentrations of relevant markers and their z-scores (calculated using log normalized population). Shown here are all GA-II cases (1–7), carriers (8–9) and the false positive specimens (10–21) from defined cohort weighing > 1.5 kg who has an out-of-range screen from GA-II on initial specimen. Among the false positives, cases 16–21 are those infants which we consider as not having had complete diagnostic evaluation

Acylcarnitine concentrations that exceed the cut-off and z-scores that exceed 3 are shown in bold
