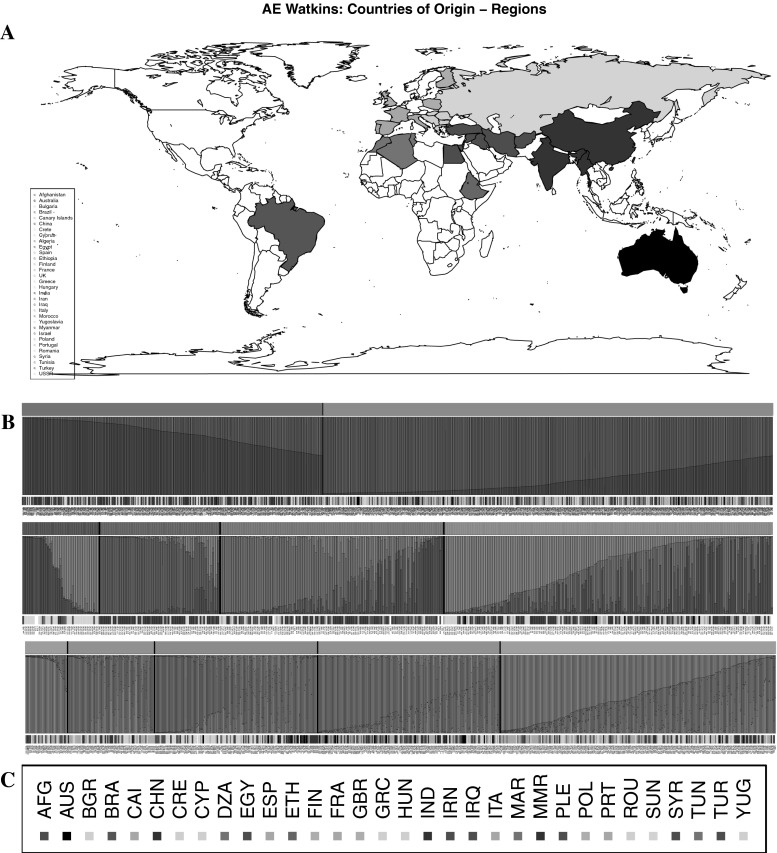
Fig. 2.
a The world map. Countries from which LCs were acquired are coloured. Colours are organised in geographic regions. b STRUCTURE assignment of the Watkins LCs to ancestral populations. Three panels shown. Top panel whole collection; middle and lower panel the 424 and 630 subpopulations of the whole collection, respectively. Each panel is divided into three rows. Top row assignment to ancestral population; middle row ancestral characteristics of each line; bottom row colour code of country/region of origin. Abbreviated names of the LCs are given below the bottom row. c Colour code of the countries, according to geographic regions

