
Fig. 3.
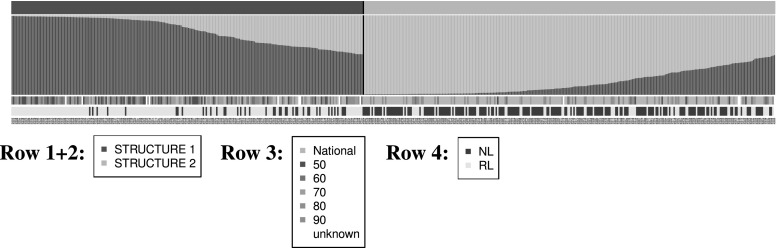
Representation of the STRUCTURE assignment of the Gediflux MCs into two ancestral populations. The panel is divided into four rows which show (from top to bottom): Row 1 assignment to ancestral population as detected by STRUCTURE (population 1: dark green, population 2: light green). Row 2 ancestral characteristics of each line as detected by STRUCTURE (colours as in row 1). Row 3 colour code of decade of release for varieties from the EU recommended list. Row 4 colour code of origin: EU recommended list (green) or UK national list (yellow). The accession numbers of the Gediflux varieties are given below row 4. Legends with colour code for the different rows are given below the plot (colour figure online)