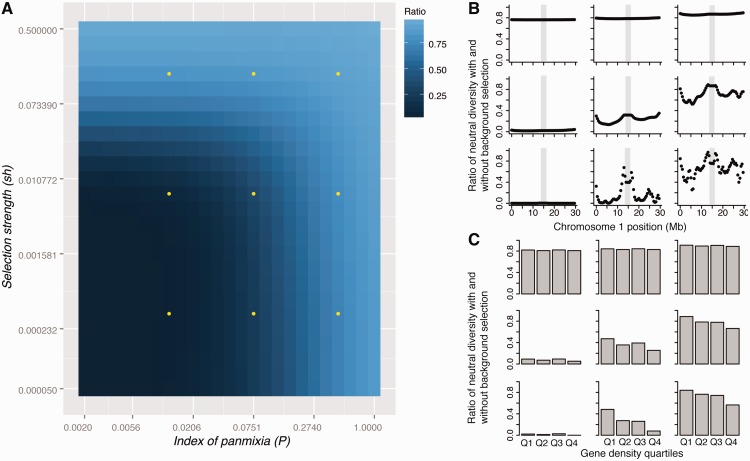
Figure 1:
Expected impact of background selection on neutral diversity in A. thaliana. (A) The predicted reduction in neutral diversity (ratio of neutral diversity with versus without background selection) is plotted over a grid of two parameters which measure the strength of selection (sh, a combined parameter incorporating the selection intensity and the dominance coefficient) and the deviation from panmixia (P). Dots indicate the parameter combinations plotted in panels (B) and (C). The three different values of P correspond to outcrossing rates of 0.06%, 3.9% and 29.9%, assuming all deviation from panmixia is a result of self-fertilization, and the sh values are 5 × 10⁻⁵, 3 × 10⁻³ and 0.1. (B) Relative proportions of neutral diversity across A. thaliana chromosome 1 for the nine parameter combinations indicated in A. Grey boxes mark the centromeric region on chromosome 1. (C) Conditions under which background selection is expected to lead to a negative correlation between gene density and neutral diversity. The predicted reduction of neutral diversity under background selection is shown for four quartiles of gene density, ranging from those with the lowest gene density (Q1) to those with the highest gene density (Q4).

