Figure 2.

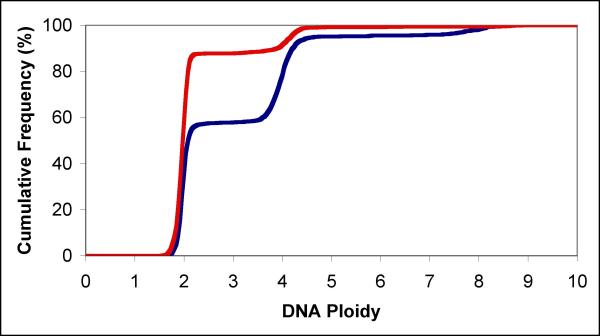
Cumulative DNA frequency distributions Cumulative DNA frequency distributions for 10 μl mock treated (red line) and 10 μl APF (blue line) treated normal bladder epithelial cells were used to calculate cell cycle sub-population fractions.

Cumulative DNA frequency distributions Cumulative DNA frequency distributions for 10 μl mock treated (red line) and 10 μl APF (blue line) treated normal bladder epithelial cells were used to calculate cell cycle sub-population fractions.