Figure 2.

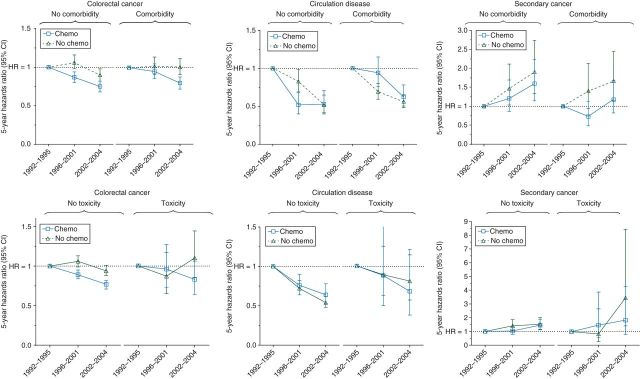
Five-year cause-specific hazard ratio, stratified by chemotherapy and by presence of complications. Chemotherapy recipients and nonrecipients were matched by propensity score of receiving chemotherapy.

Five-year cause-specific hazard ratio, stratified by chemotherapy and by presence of complications. Chemotherapy recipients and nonrecipients were matched by propensity score of receiving chemotherapy.