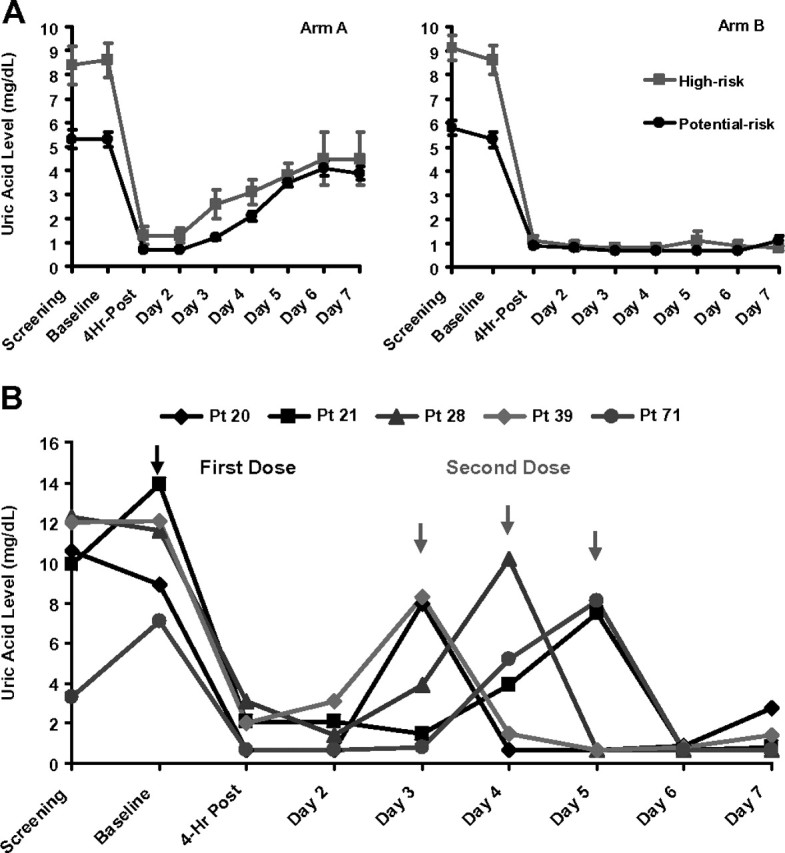
Figure 2.

(A) Plasma uric acid (UA) levels (mean ± SEM) during the study period. Left panel shows plasma UA profile over the study period in arm A stratified by the risk group. Right panel shows plasma UA profile over the study period in arm B stratified by the risk group. (B) Timing of a second dose of rasburicase in a subset of high-risk patients within arm A requiring additional therapy. Five patients needed a second dose of rasburicase during the study period (days 2–5). Two patients on day 3, one patient on day 4, and two patients on day 5.
