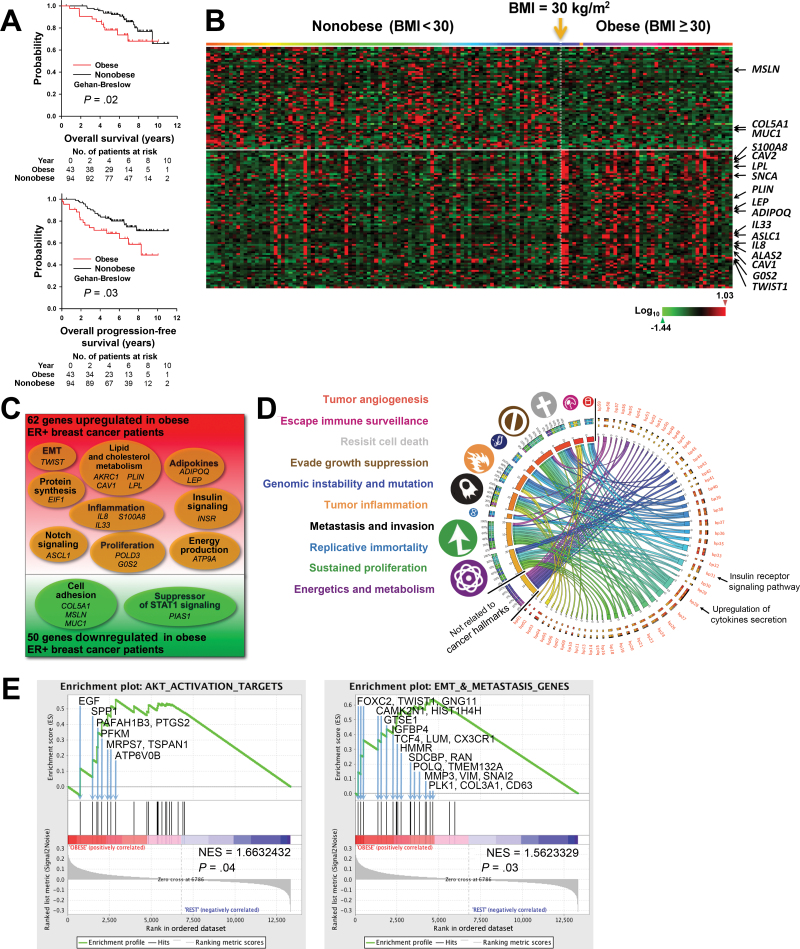
Figure 1.
Transcriptomic changes and adverse clinical outcomes associated with obesity in a prospective cohort of estrogen receptor–positive (ER+) breast cancer (BC) patients. A) Kaplan–Meier analysis of the overall survival (left panel) and progression-free survival (right panel) of untreated ER+ BC patients in Gene Expression Omnibus dataset GSE-20194 who were obese (body mass index [BMI] ≥ 30.0kg/m2; red; n = 43) or nonobese (BMI < 30kg/m2; black; n = 94). Gehan–Breslow test was used to calculate the P values. B) Heat map of the 130 gene probes with statistically significant changed expression (P ≤ .01; log ratio > 0.1) appearing in the same order as in Supplementary Table 3 (available online). Patients were arranged in ascending order of BMI from left to right. BMI of 30kg/m2 is indicated by the yellow arrow. C) Venn diagram of microarray data of pretreatment tumor biopsies, which identified 112 genes with statistically significantly changed expression (P ≤ .01; log ratio > 0.1) between obese and nonobese patients. D) Circos plot of the connections of statistically significantly changed biological processes (bp01 to bp50; P<.05) (see also Supplementary Table 4, available online) to cancer hallmarks (symbols and color-coded labels at left). The widths of the connectors represent the absolute values of the biological process Z scores. E) Gene set enrichment analyses (GSEAs) for AKT activation target genes (left panel) and genes involve in the epithelial–mesenchymal transition (EMT) and metastasis (right panel). Each bar corresponds to one gene. GSEA results with gene symbol, gene name, and gene enrichment scores of all genes included in each gene set are listed in Supplementary Table 5 and Supplementary Table 8 (available online).

