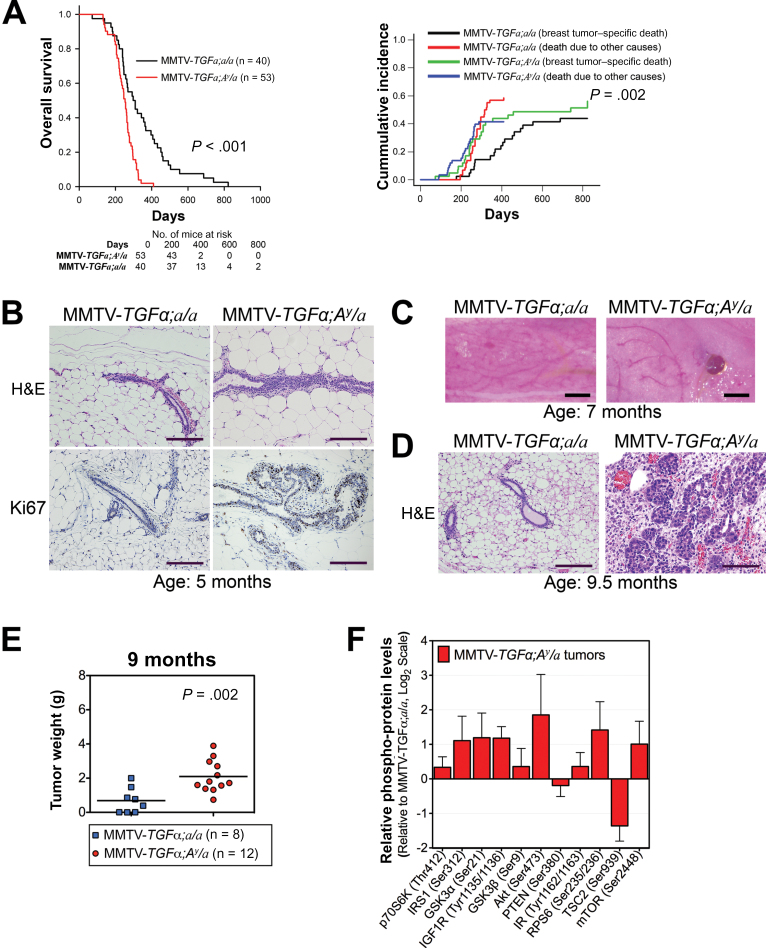
Figure 3.
Effect of obesity on oncogene-driven breast carcinogenesis and tumor progression in mice. A) Kaplan–Meier analysis of overall survival (left panel) and Fine–Gray competing risk analysis of breast tumor–specific death (right panel). Two-sided log-rank test (left panel) and Fine–Gray competing risk analysis (right panel) were used to calculate the P values. B) Representative hematoxylin and eosin (H&E)–stained slides (top panels) and Ki67 immunohistochemical analysis (bottom panels) of mammary ductal epithelium. Images were captured at ×10 magnification, and scale bars represent 200 µm. C) Representative pictures of fourth mammary fat pads illustrating a difference in tumor formation. Scale bars represent 1mm. D) Representative hematoxylin and eosin–stained slides of mouse mammary tissue. Images were captured at ×10 magnification, and scale bars represent 200 µm. E) Tumor weights of obese mice (blue) and lean mice (red) killed at the age of 9 months in the cross-sectional study. Statistical significance was calculated by two-tailed t test. F) Phospho-protein levels of members of the AKT/mTOR signaling pathway from tumor lysates of MMTV-TGFα;A y /a obese mice (n = 7) plotted relative to those from MMTV-TGFα;a/a lean mice (n = 5). Error bars in panel (F) and Supplementary Figure 3 represent 95% confidence intervals.

