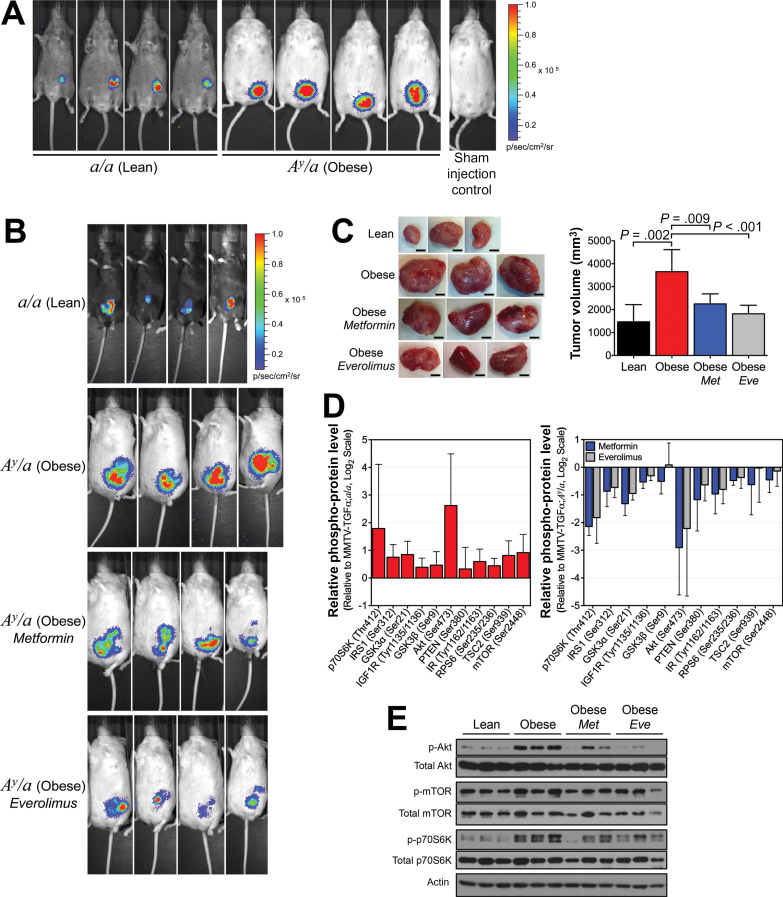
Figure 5.
Effect of obesity on breast cancer progression and tumor growth in orthotopic/syngeneic mice. A) Representative in vivo bioluminescent imaging of tumors performed 4 weeks after orthotopic/syngeneic allografting of EO771-FG12 cells into female transgenic lean and obese mice negative for the MMTV-TGFα transgene (n = 7 mice per group). B) Representative in vivo bioluminescent imaging of tumors performed 4 weeks after orthotopic/syngeneic allografting of EO771-FG12 cells into female a/a lean mice (n = 7), A y /a obese mice (n = 6), A y /a obese mice treated with metformin (300mg/kg daily; n = 6) and A y /a obese mice treated with everolimus (4mg/kg daily; n = 8). C) Representative images of syngeneic allografted tumors harvested from randomized lean, obese, metformin-treated, and everolimus-treated obese female mice (scale bars represent 5mm; left panel). A bar graph illustrates the mean tumor weights from the same experiment (n = 6–8 mice per group; right panel). Statistical significance was calculated by one-way analysis of variance. D) Phospho-protein levels of members of the AKT/mTOR signaling pathway from syngeneic allografted tumor lysates from obese mice plotted relative to those from lean mice (n = 5). E) Western blot analysis of total and phospho-AKT (Ser473), total and phospho-mTOR (Ser2448), and total and phospho-p70S6K (Thr389). Error bars in panels (B) and (D) represent 95% confidence intervals.

