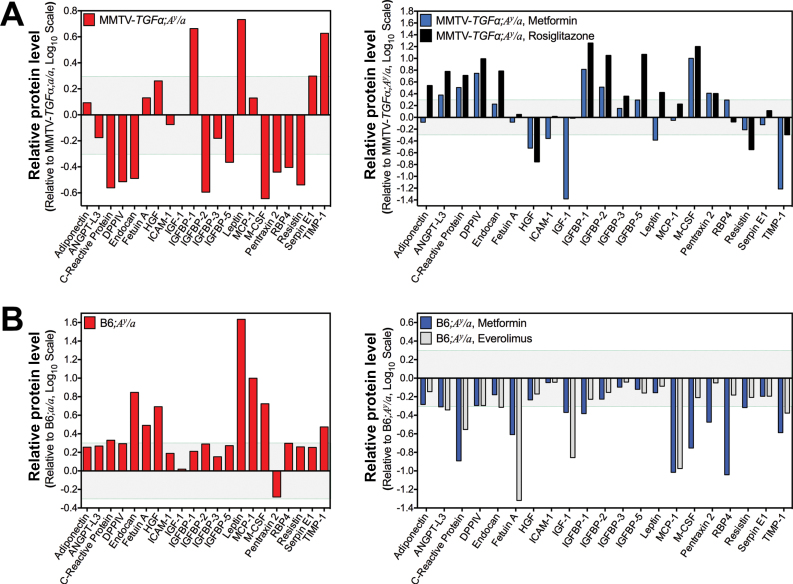
Figure 6.
Effect of metformin and everolimus on serum adipokine levels in obese mice. A) Serum adipokines profile. Relative protein level presented as log ratio of integrated optical density of the microarray dot blot in the MMTV-TGFα;A y /a obese mouse pooled sera array relative to that in the MMTV-TGFα;a/a lean mouse pooled sera array is plotted (n = 3 mice per group composite) for each adipokine tested (left panel). Protein level presented as log ratio of integrated optical density of the microarray dot blot in the metformin-treated obese mouse pooled sera array relative to that in the untreated obese mouse pooled sera array is plotted (n = 3 mice per group composite) for each adipokine tested (right panel). B) Serum adipokines profile. Relative protein level presented as log ratio of integrated optical density of the microarray dot blot in the A y /a obese mouse pooled sera array relative to that in the a/a lean mouse pooled sera array is plotted (n = 3 mice per group composite) for each adipokine tested (left panel). Protein level presented as log ratio of integrated optical density of the microarray dot blot in the metformin-treated and everolimus-treated obese mouse pooled sera arrays relative to that in the untreated obese mouse pooled sera array is plotted (n = 3 mice per group composite) for each adipokine tested (right panel).

