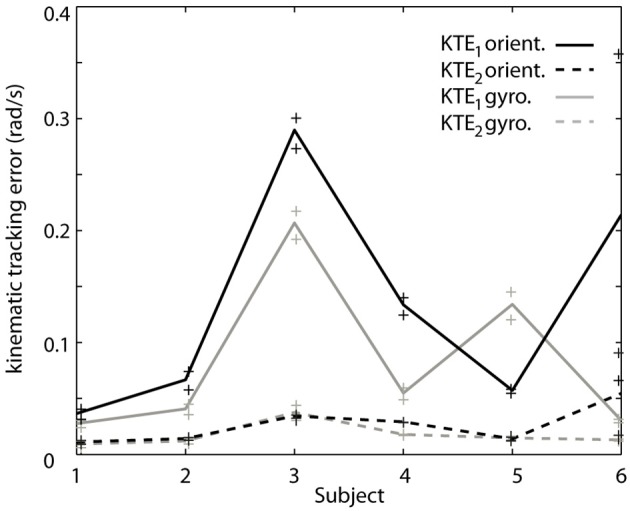
Figure 5.

Contribution of each of the components of the KTE representing relative performance of the gyroscope method (gray) and the orientation based method (black) relative to an offline reference method based on gyroscope data. The KTE1 (mean of the absolute tracking error) is represented by the continuous lines, whereas the KTE2 (variance of the absolute tracking error) is plotted in dotted lines. The data plotted in the curves is the average across trials for each patient, minimum and maximum performance is represented by “+” for each patient.
