Figure 5.
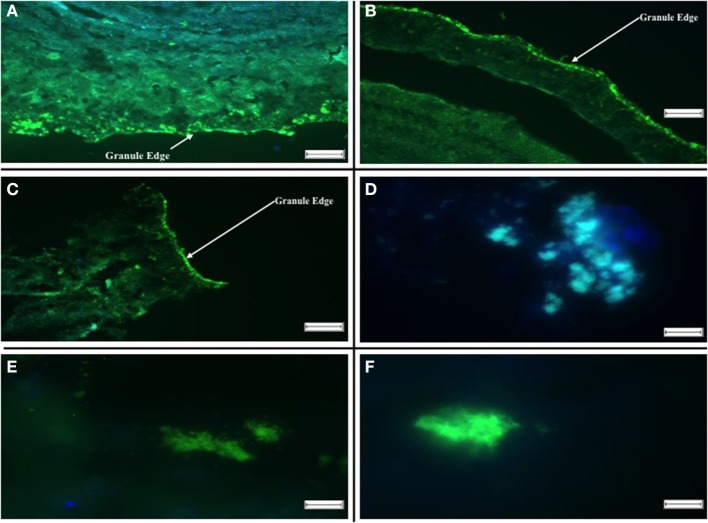
Fluorescent in situ Hybridizations illustrating localization of archaeal and SRB populations in aggregates. (A) R1 Day 515: Hybridization probes DBB 660 [green] and SRB 385 [blue]. (B) R2 Day 515: Hybridization probes DBB 660 [green] and SRB 385 [blue]. (C) R1 Day 602: Hybridization probes SRB 385 [green] and ARC 915 [blue]. (D) R2 Day 602: Hybridization probes DBB 660 [green] and ARC 915 [blue]. (E) R1 Day 742: Hybridization probes DBB 660 [green] and SRB 385 [blue]. (F) R2 742: Hybridization probes DBB 660 [green] and SRB 385 [blue]. The scale bar in (A–C) is 100 μm, and the arrows indicate the aggregate surface, the scale bar in (D–F) is 10 μm.

