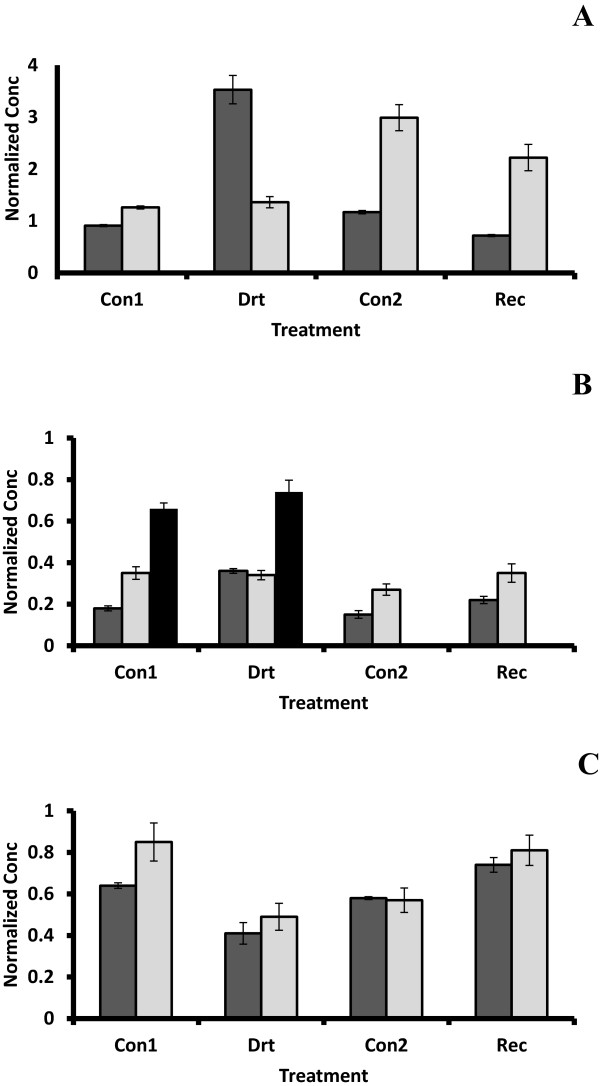
Figure 4.

Quantitative analysis of MpNPR1-2 expression during water deficit and recovery. Expression was assessed by quantitative RT-PCR as described in Methods. Concentrations were determined by normalization with TEF2, and the results from two independent experiments were averaged. Standard error bars are indicated on the columns. A: Root; B: Bark and Xylem; C: Leaf. Con1 and Con2: well watered control plants for water deficit treatment and recovery, respectively, Drt: water deficit treatment and Rec: recovery. Light gray columns = 2005 experiment; dark gray and black (xylem) columns = 2008 experiment.
