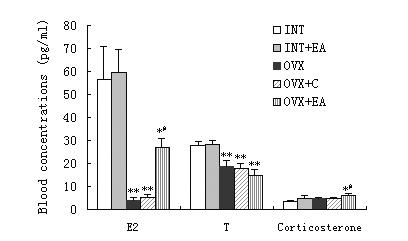
Figure 2.

The blood concentrations of E2, testosterone and corticosterone of the INT (n = 12), INT+EA (n = 12), OVX (n = 12), OVX+C (n = 12) and OVX+EA (n = 10) rats. *p < 0.05 vs INT and INT+EA; ** p < 0.01 vs INT and INT+EA; # p < 0.05 vs OVX and OVX+C.
